Spatial technologies and their impact.

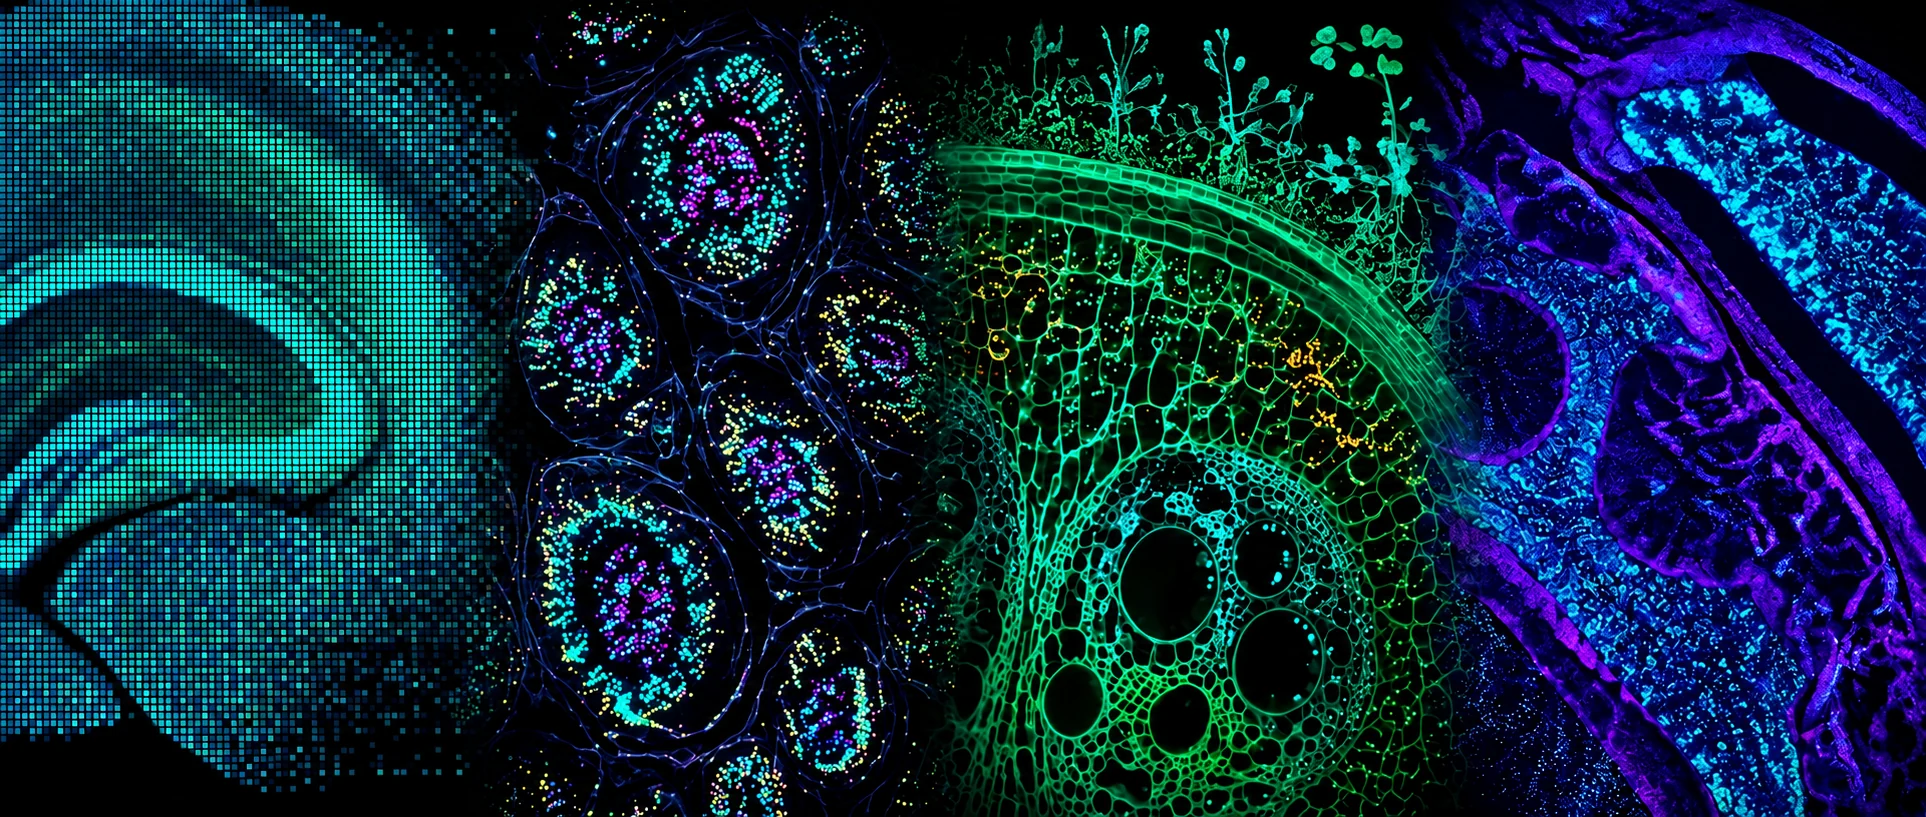
Four fluorescence microscopy panels: a pixelated map of gene expression across brain tissue, transcripts detected in situ as coloured dots within cell nuclei, a plant stem cross-section, and a densely labelled tissue section.

Reading molecules in their tissue context.

Members of the cluster invented the methods that measure molecules while retaining information on their position in tissues, and keep extending them to finer resolution and more molecular layers.

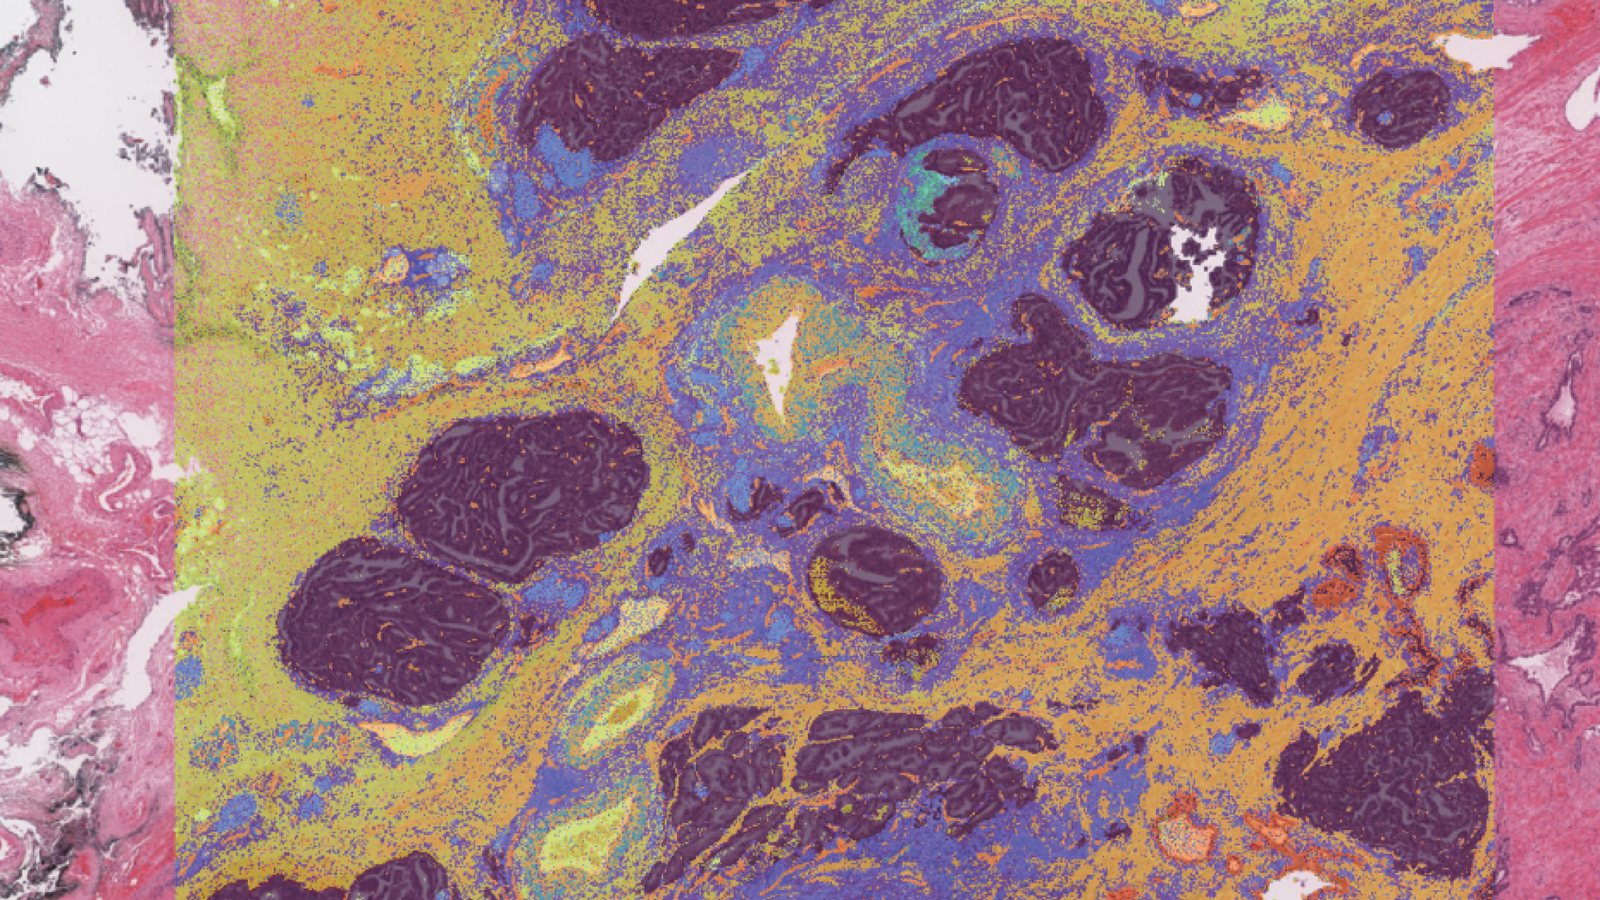
An H&E-stained tissue section with a spatial transcriptomics map overlaid on its centre, colouring distinct tissue regions.

Spatial Transcriptomics – Sequencing-Based

Spatially barcoded capture arrays read the whole transcriptome from an intact tissue section while tying every measurement to its position. Joakim Lundeberg co-pioneered the method with Jonas Frisén, and it became Visium, today the most widely used spatial platform. Later work cleared and physically expanded tissue before capture to raise resolution, and added mass spectrometry imaging of metabolites on the same Visium slide.

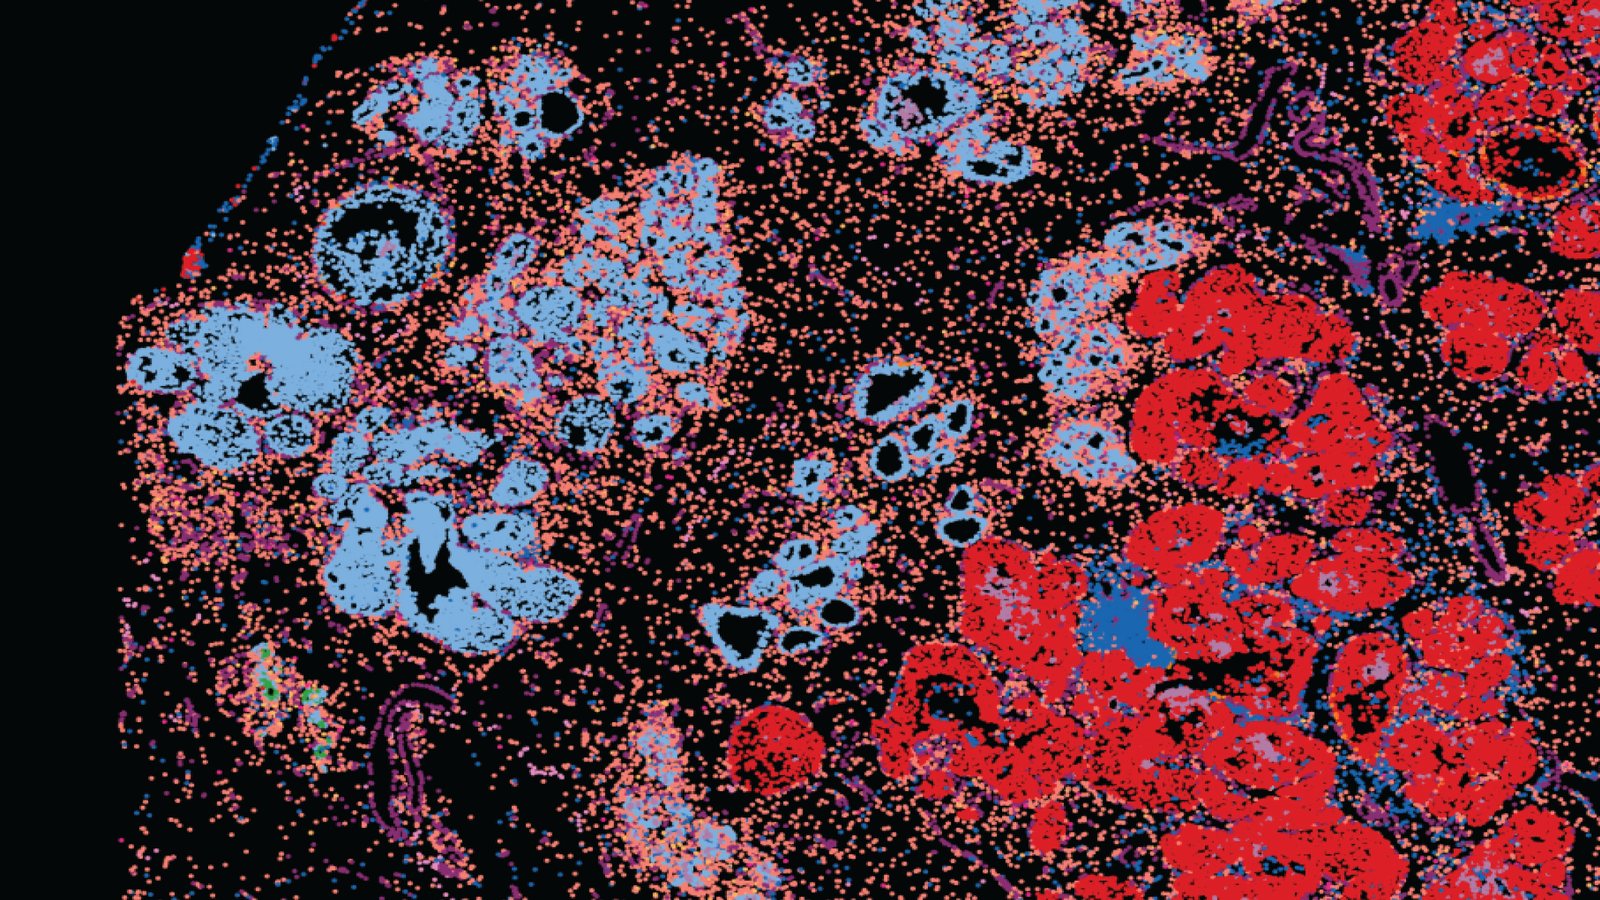
In situ sequencing of a tissue section on black: coloured spots mark individual transcripts, which gather into distinct groups of cells.

Spatial Transcriptomics – Imaging-Based

A padlock probe closes into a circle only when both of its ends find their exact target. Copied in place by rolling-circle amplification, each probe is detected as a bright spot, anchored to a single target molecule. Mats Nilsson invented the padlock probe and went on to read short sequences directly inside preserved tissue with in situ sequencing, later moving to a hybridisation-based barcoding chemistry, HybISS. This work helped form the foundation of Xenium.

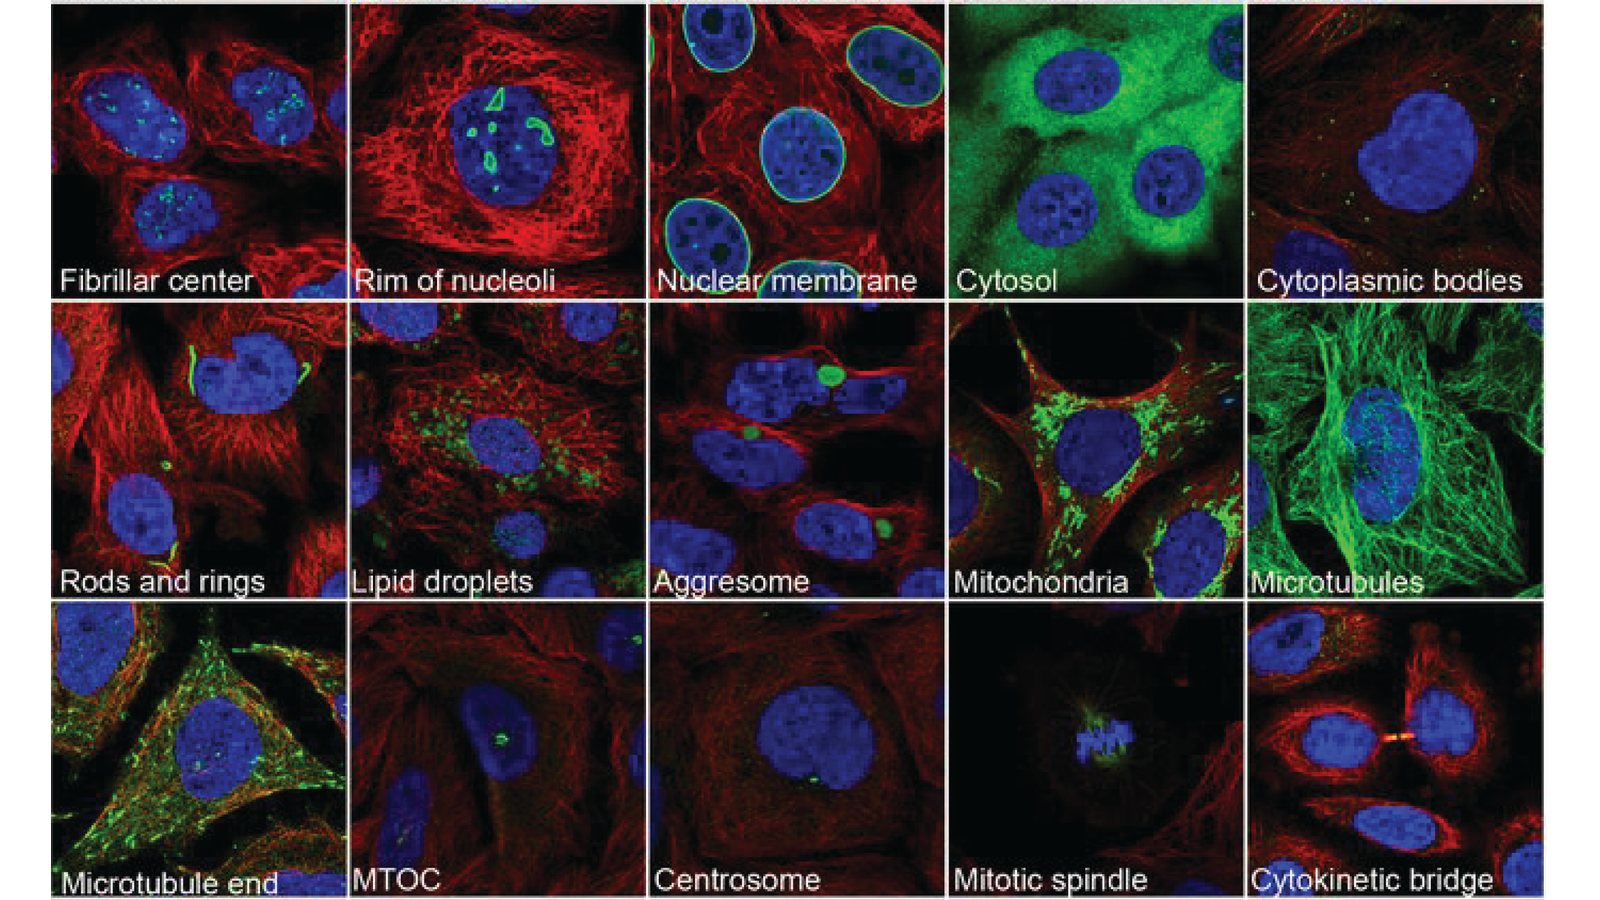
Fifteen immunofluorescence images of human cells, each showing a protein in green in a different subcellular structure, from the fibrillar centre and nuclear membrane to mitochondria, microtubules and the cytokinetic bridge.

Spatial Proteomics

Emma Lundberg's group built the Cell Atlas of the Human Protein Atlas, integrating transcriptomics with antibody-based imaging validated by mass spectrometry. It placed 12,003 human proteins in 30 subcellular structures and found about half of them in more than one compartment. To classify images at that scale, the group has combined deep learning with citizen science and run an open image-classification competition.

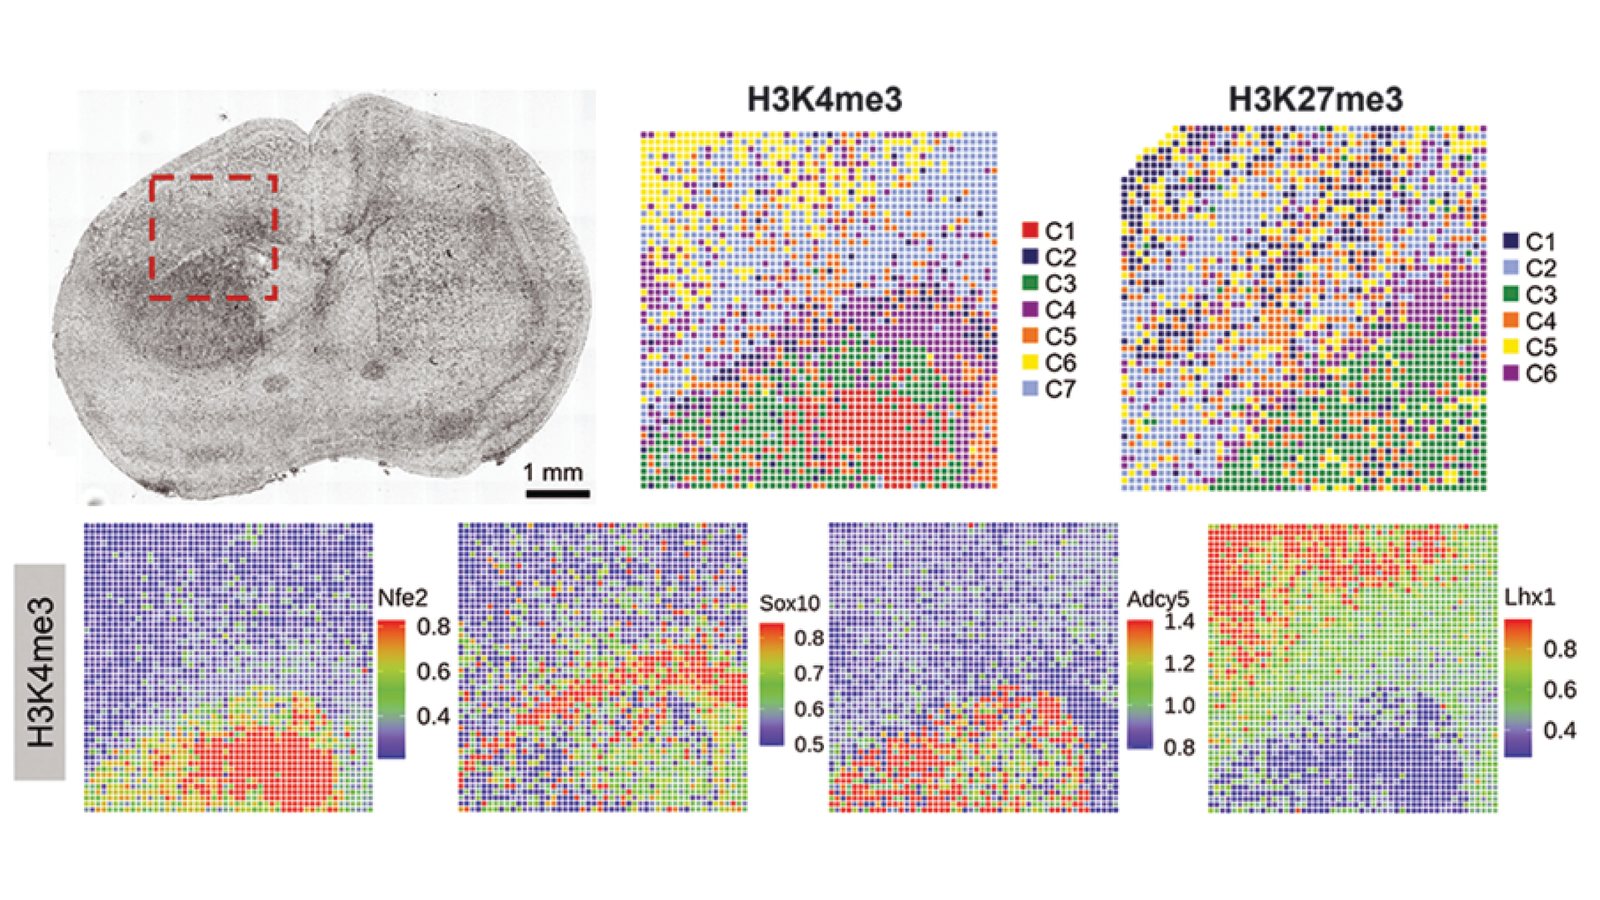
Spatial-CUT&Tag maps of a mouse brain section: the tissue beside clusters of the H3K4me3 and H3K27me3 histone marks, and H3K4me3 signal at Nfe2, Sox10, Adcy5 and Lhx1.

Spatial Epigenomics

Chromatin states decide which genes a cell can use. Working with Rong Fan's group at Yale, Gonçalo Castelo-Branco's group helped bring chromatin profiling into intact tissue: Spatial-CUT&Tag maps histone modifications, spatial-ATAC-seq maps chromatin accessibility, and joint methods read the epigenome and the transcriptome from the same section.

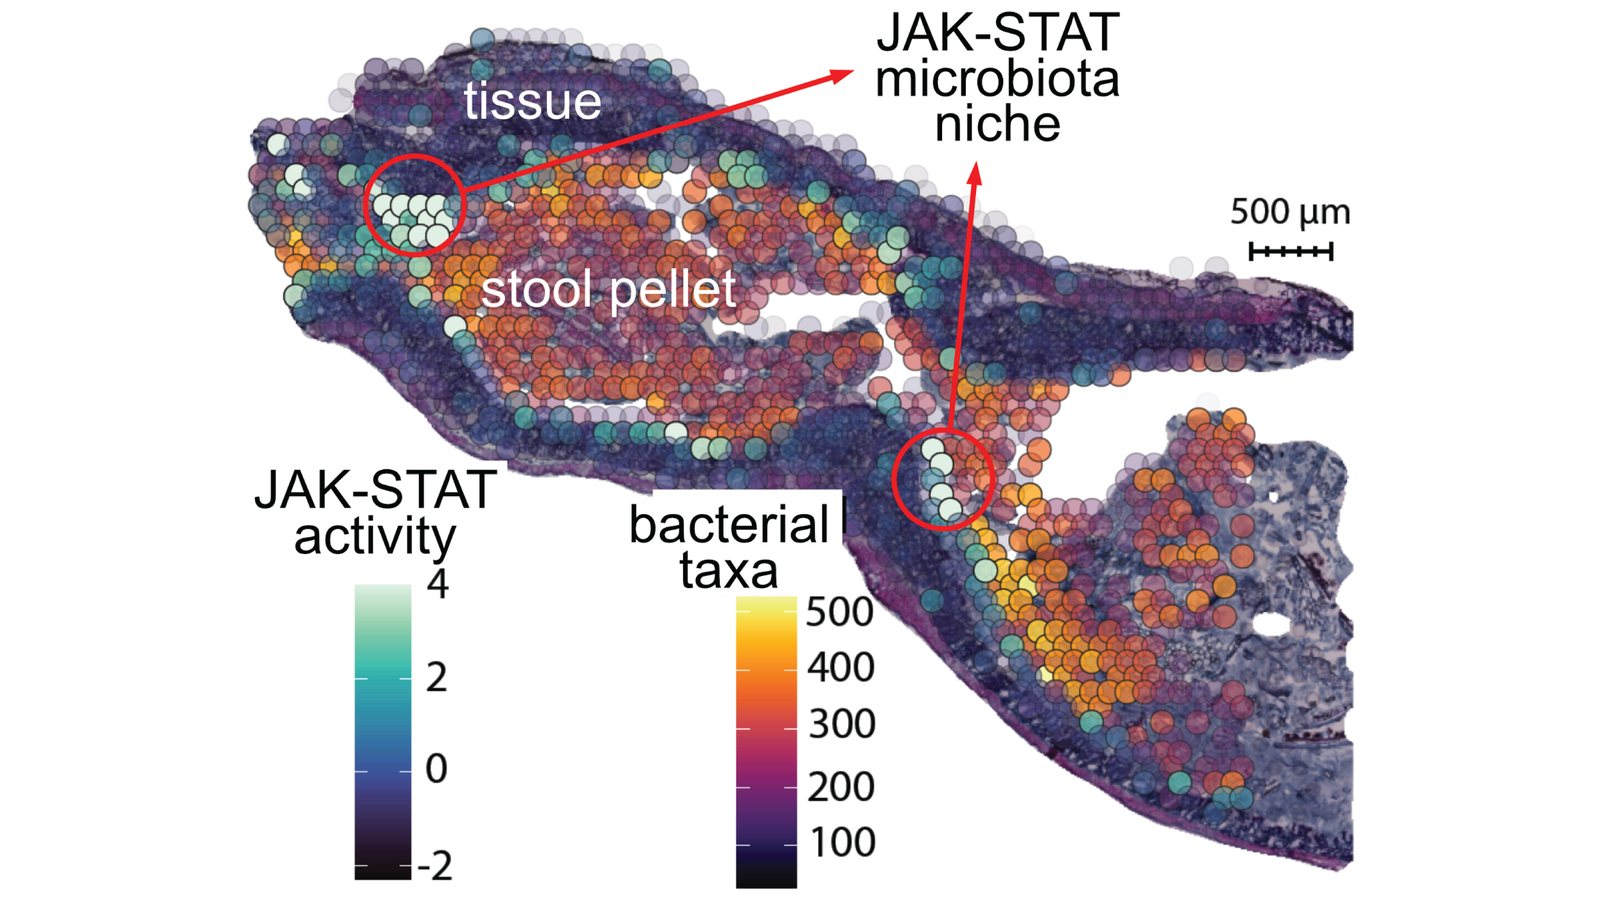
A gut section profiled by spatial metatranscriptomics, coloured by the number of bacterial taxa and by host JAK-STAT activity, with circles marking JAK-STAT microbiota niches where tissue meets the stool pellet.

Spatial MetaTranscriptomics

Stefania Giacomello's group developed spatial metatranscriptomics in collaboration with Detlef Weigel's lab at the Max Planck Institute. The technology uses multimodal capture arrays to profile a host's transcriptome together with its bacteria and fungi on the same tissue section, resolving host–microbe interactions where they happen. It builds on the first adaptation of spatial transcriptomics to plant tissue across a range of model species, work Giacomello led as a postdoctoral researcher.

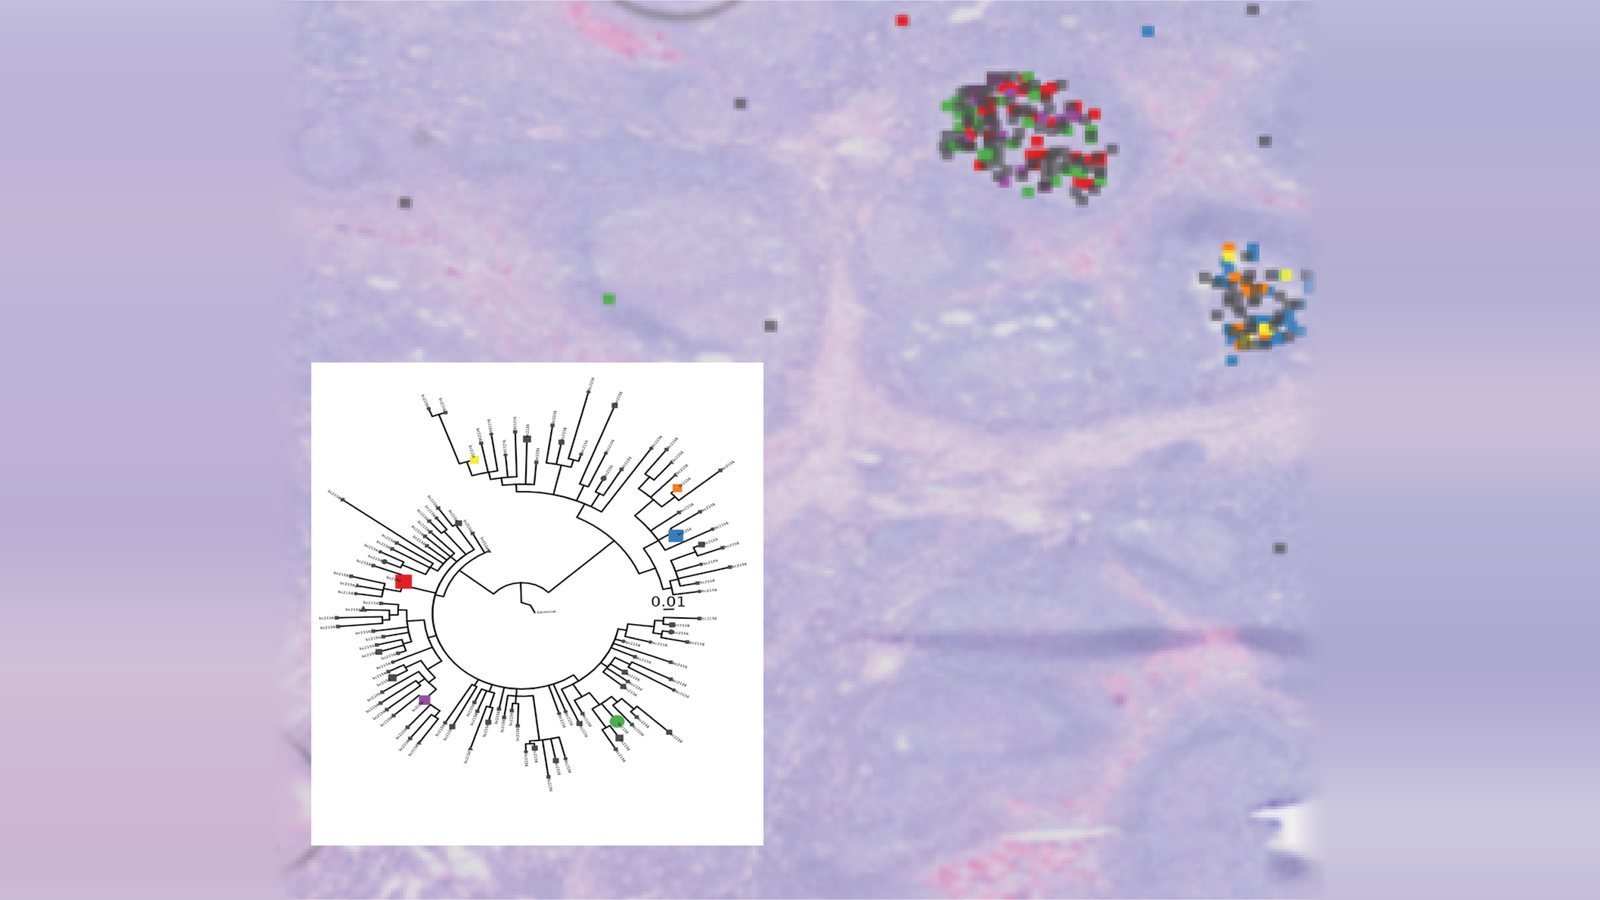
Spatial VDJ on a tissue section: coloured squares mark B cell clones in two clusters, and an inset lineage tree shows how their receptor sequences are related.

Spatial VDJ Sequencing

Spatial VDJ sequencing is a tool for spatial immunology, the study of how immune cells and their responses are organised within tissues. It captures B cell and T cell receptor sequences on the same tissue section as the transcriptome, so each lymphocyte clone can be mapped in the tissue and linked to its cellular surroundings. Camilla Engblom co-developed the method, and her group now uses it to follow B and T cell clonal dynamics in cancer.

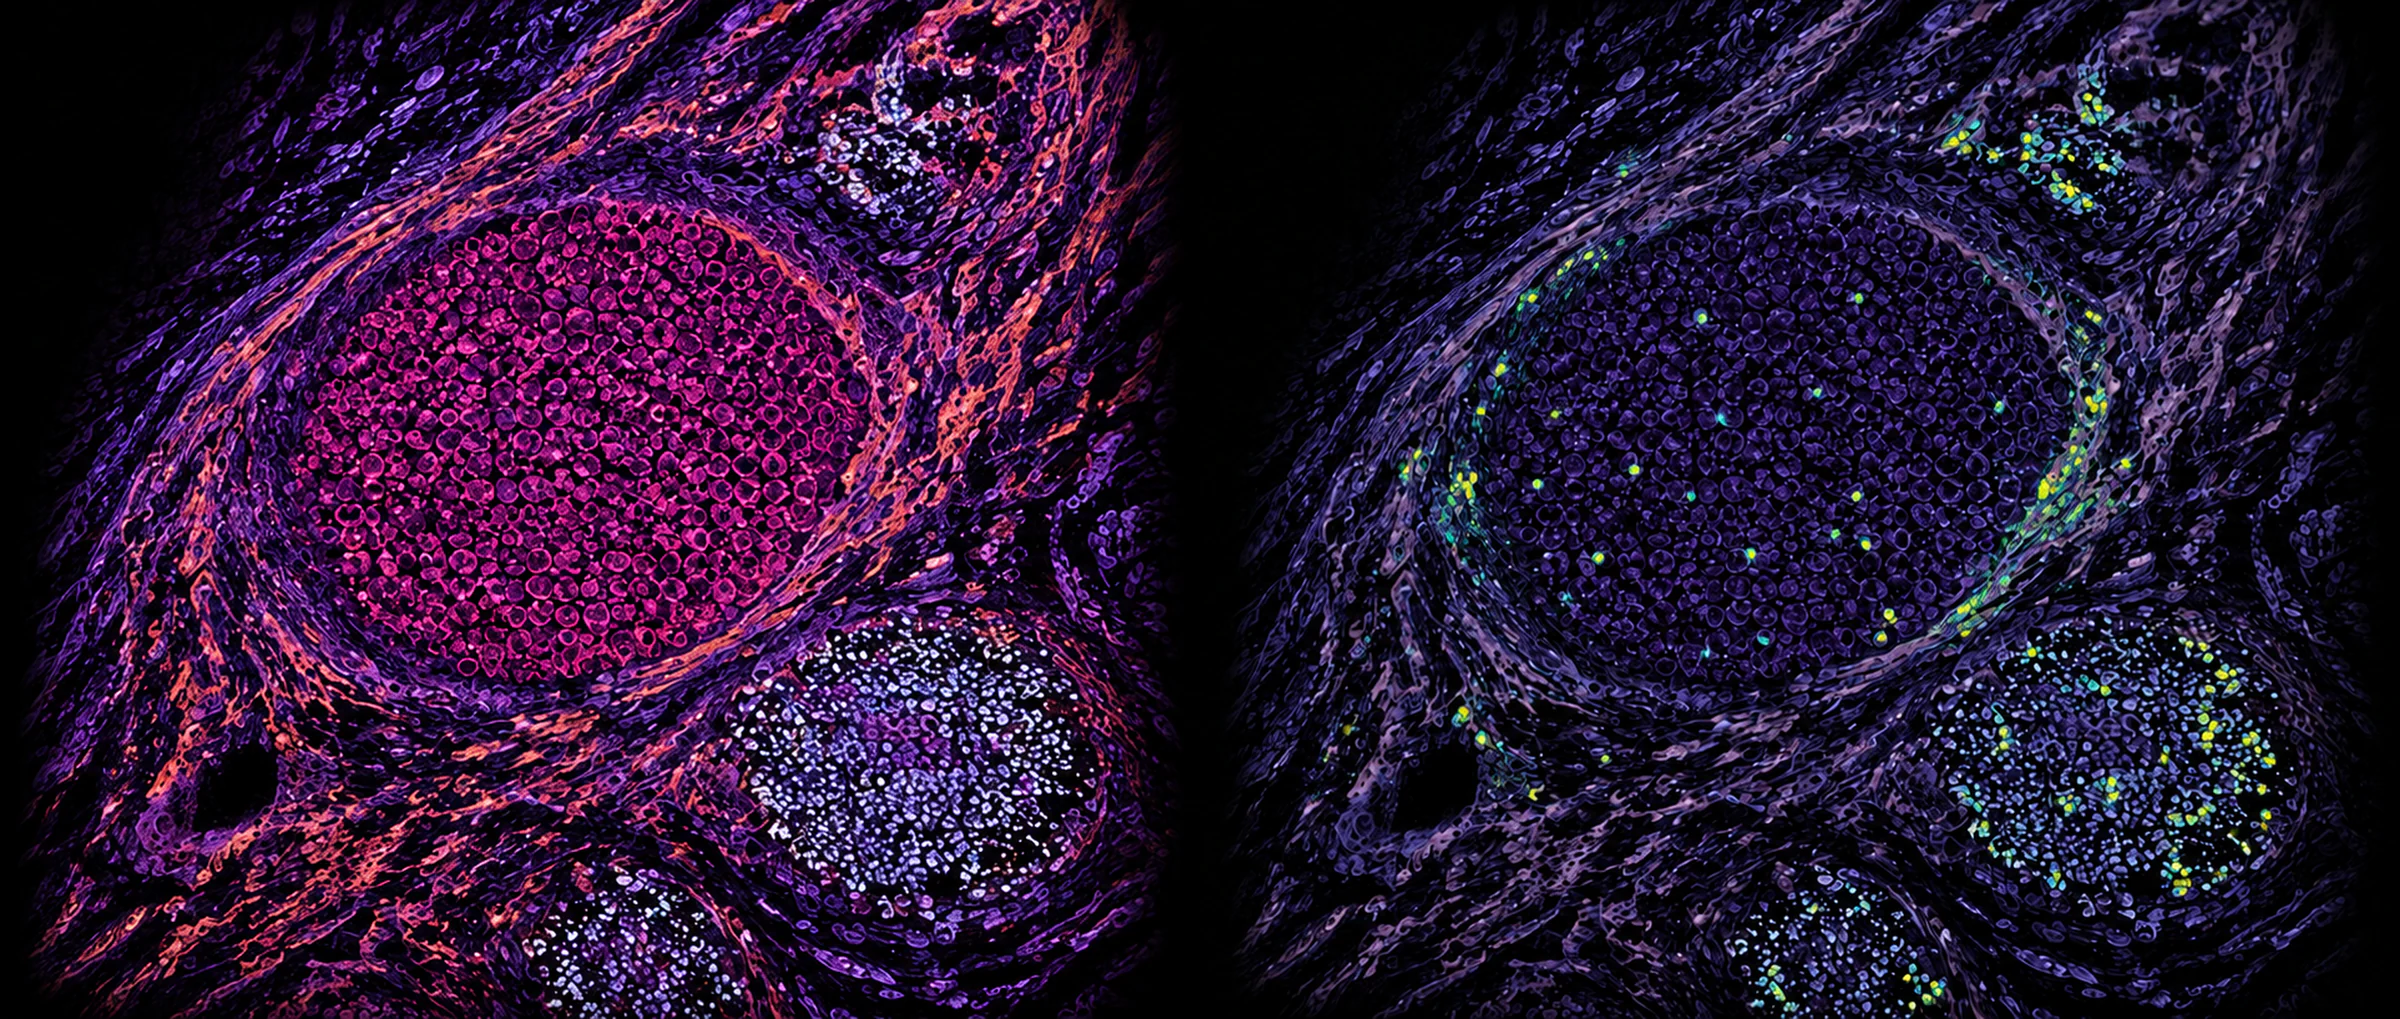
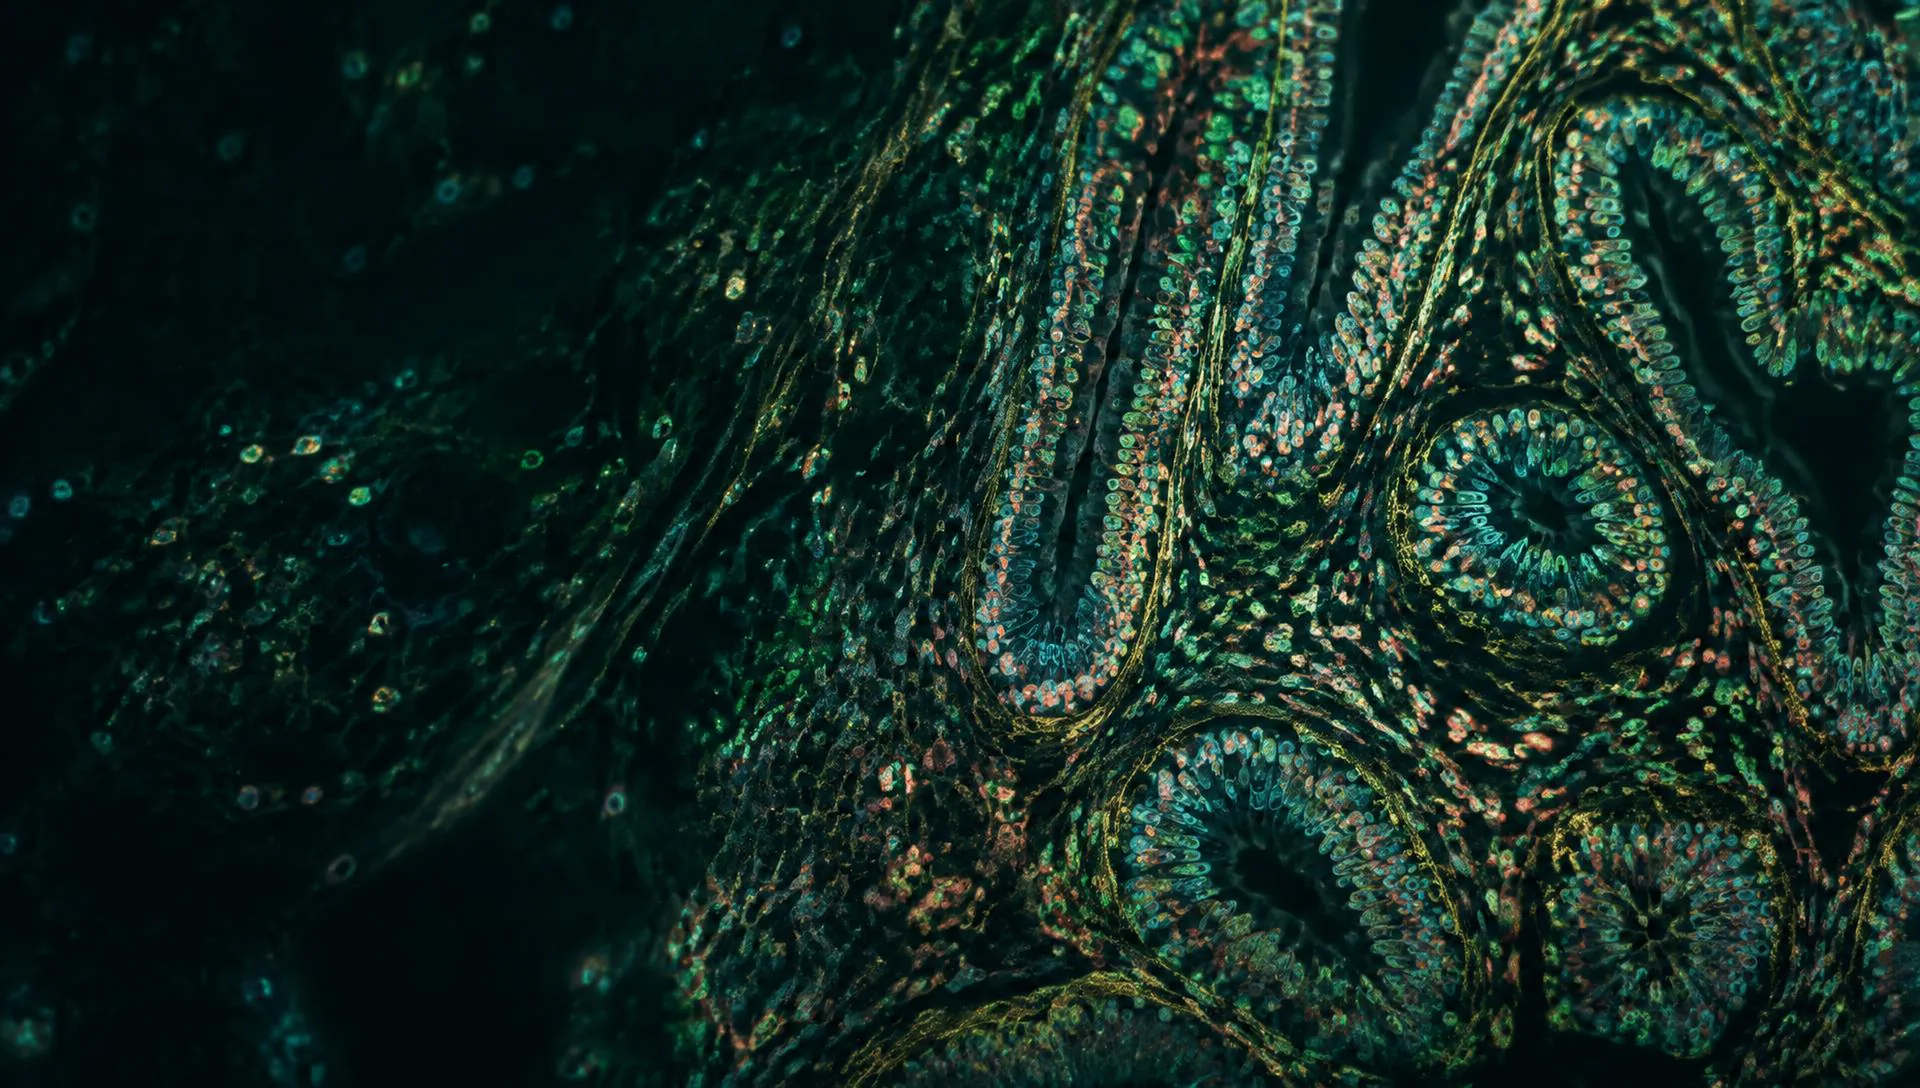
Fluorescence microscopy of a tissue section, shown twice side by side: the left panel in magenta and orange renders the cell membranes and the fibrous sheaths wrapping three densely packed lobes, the right panel renders the same field in violet with scattered yellow and green cells marking a separate signal inside and around them.

Putting spatial maps to work.

Keeping tissue context changes what biology and medicine can ask: where disease begins, which cells interact, how an organ builds itself. The same work raises questions for the clinic, for industry and for society, and the cluster’s social scientists assess which applications are closest to responsible deployment.

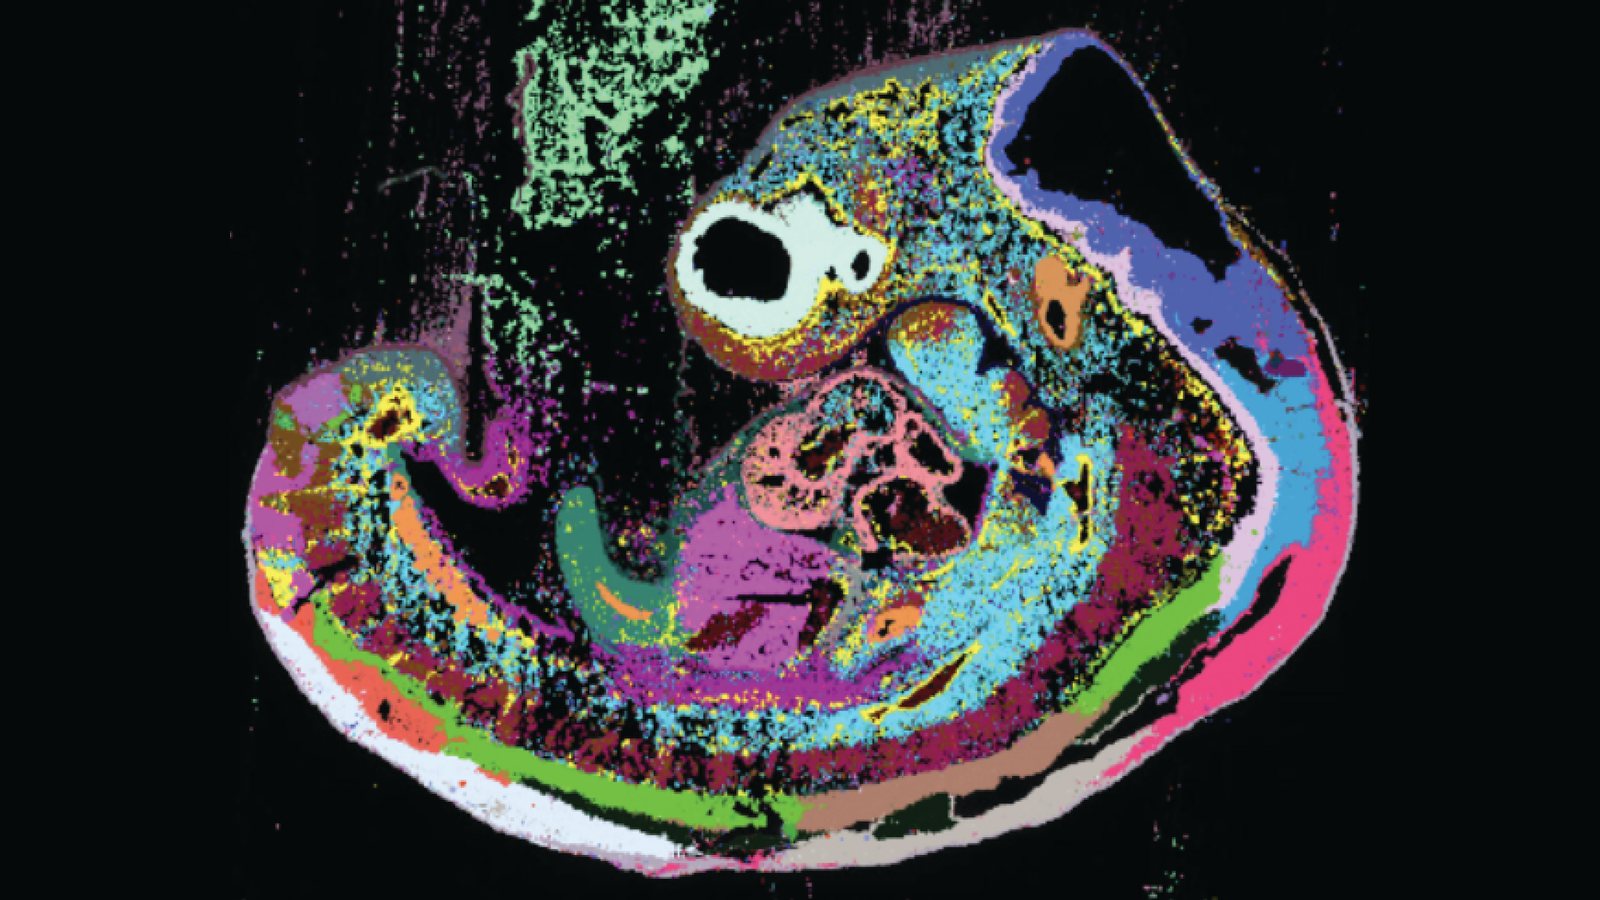
An embryo section on black, coloured by spatially mapped gene-expression clusters that outline its developing tissues.

Development and Cell Fate

Spatial methods show where cells sit and when they commit as organs form. In the developing human heart, spatial transcriptomics and in situ sequencing, combined with single-cell data, placed each cell type in its anatomical niche and shed light on how the conduction system and valves arise. In the mouse, spatial data showed where and when neural crest cells make their binary fate decisions and, paired with in utero barcoding, mapped cell lineages to distinct regions of the developing heart.

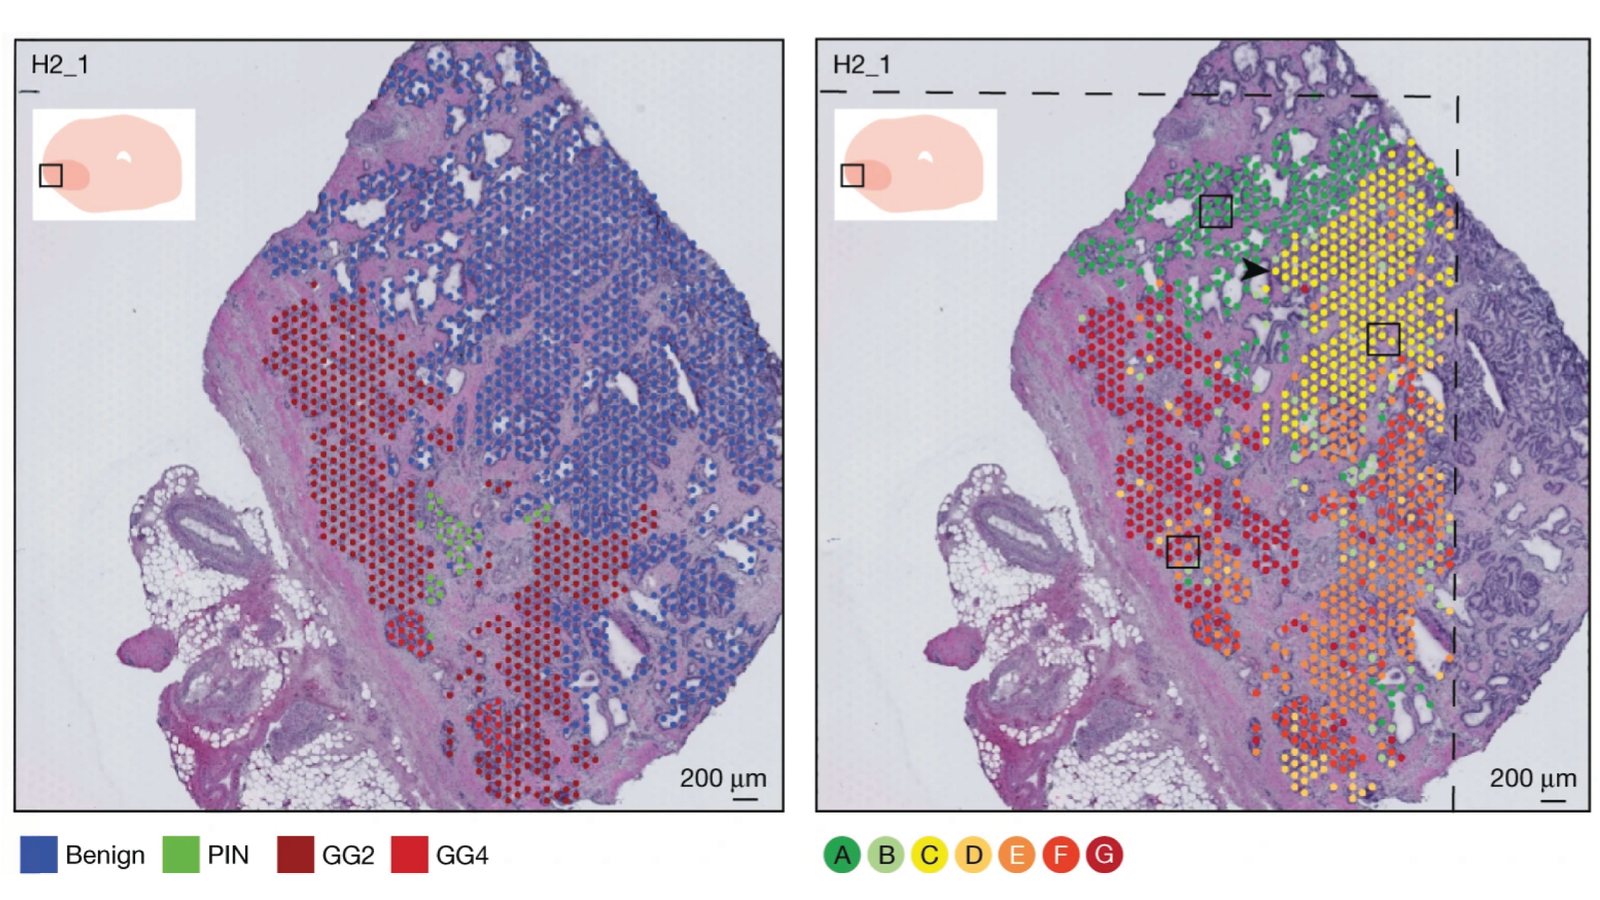
Two views of the same prostate cancer section: spots coloured by pathology, from benign glands to Gleason grade groups 2 and 4, and by inferred copy-number clones.

Cancer

Spatial maps of a multifocal prostate cancer resolved nearly 6,750 tissue regions into stroma, normal glands, immune cells and tumour, exposing heterogeneity that bulk profiling averages away. Inferring copy-number changes across more than 120,000 spatial regions then traced clonal patterns within tumours and into nearby benign tissue. In breast cancer, in situ sequencing mapped 91 diagnostic, prognostic and pathway genes and assembled them into a molecular-morphological OncoMap for each tumour.

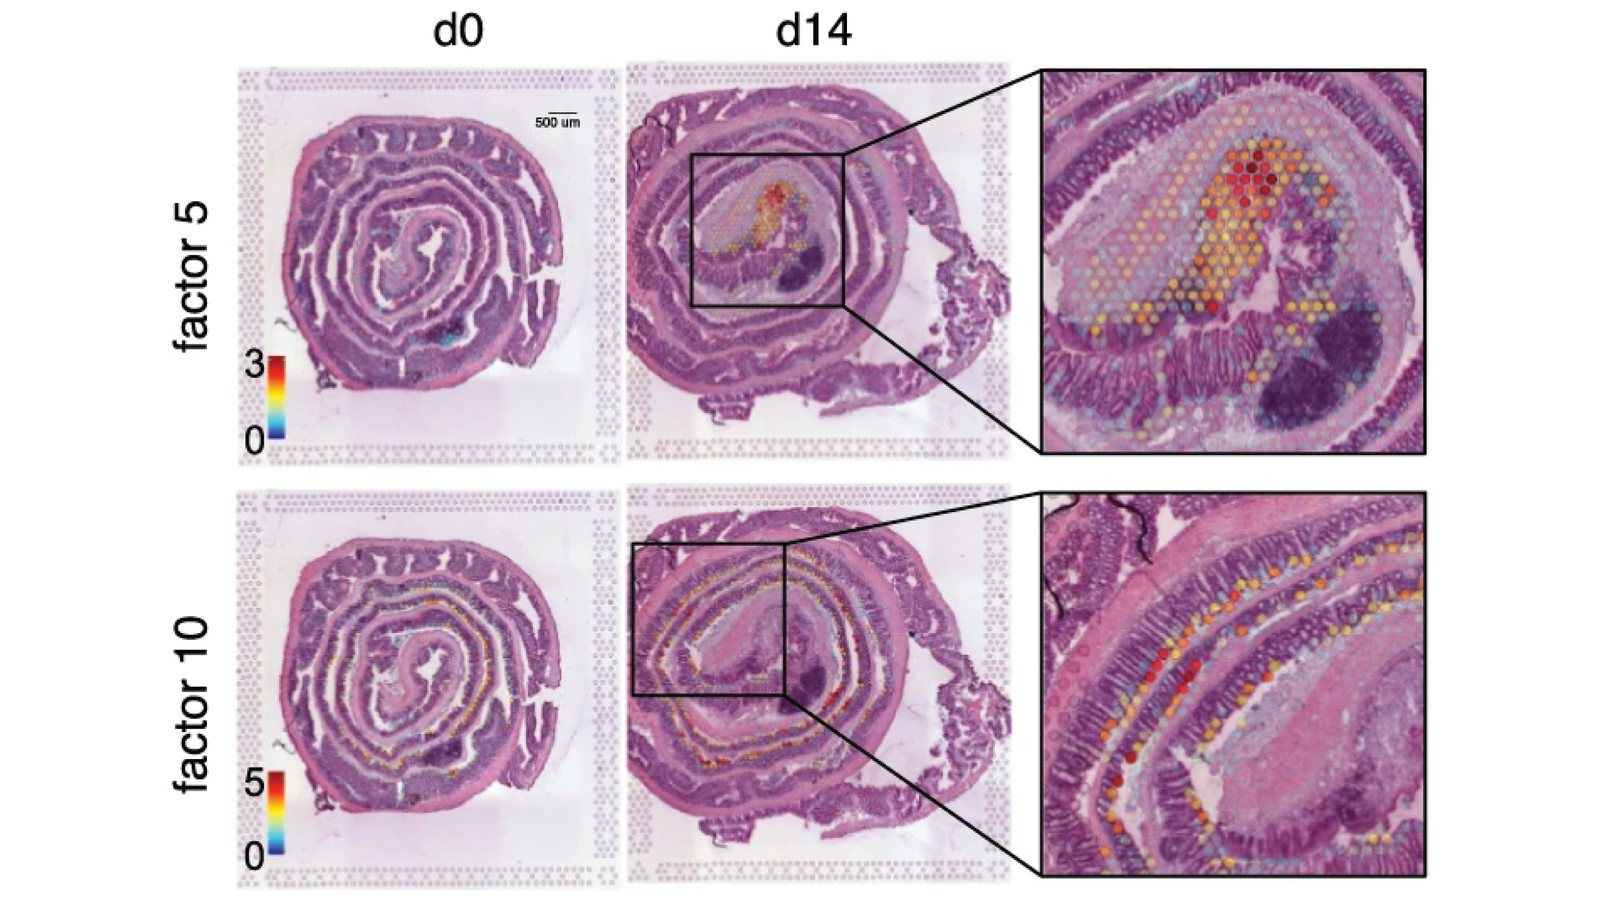
Rolled mouse colon sections at day 0 and day 14 of repair, with two spatial gene-expression programmes overlaid and enlarged to show where healing is under way.

Gut Healing

Spatial transcriptomics of the mouse colon revealed a molecular regionalisation of healthy tissue that changes dramatically during repair, and spatially organised programmes that define where healing happens. Follow-up work showed that an expanding, interferon-induced B cell subset slows recovery by disrupting the cross-talk between stroma and epithelium that regeneration needs. Eduardo Villablanca's group also developed a tissue-rolling technique that fits the entire mouse gastrointestinal tract on a single slide.

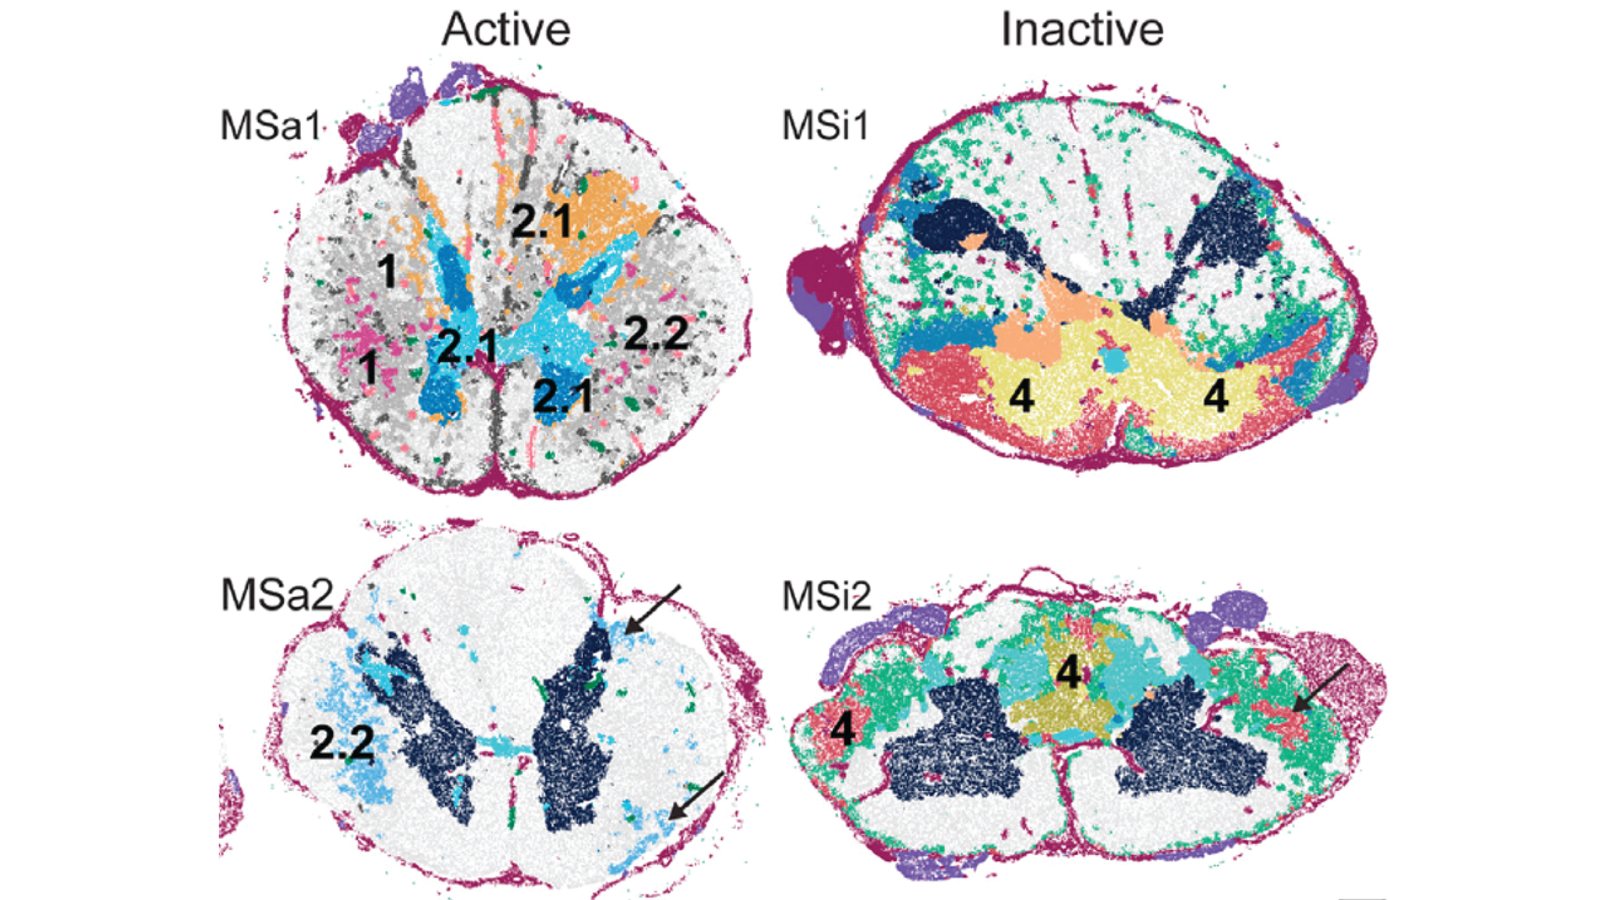
Spinal cord cross-sections labelled as active and inactive multiple sclerosis lesions, with spatially mapped cell clusters coloured and numbered across each section.

Neurological Disease

Spatial transcriptomics of mouse and human spinal cords ordered the molecular events of amyotrophic lateral sclerosis in time and space, separating early regional changes in microglia and astrocytes. Around amyloid plaques in an Alzheimer's model, it exposed early changes in myelin and oligodendrocyte genes and a network of plaque-induced genes. In multiple sclerosis, single-cell in situ sequencing showed active lesions evolving outward and disease-associated glia arising independently of lesions.

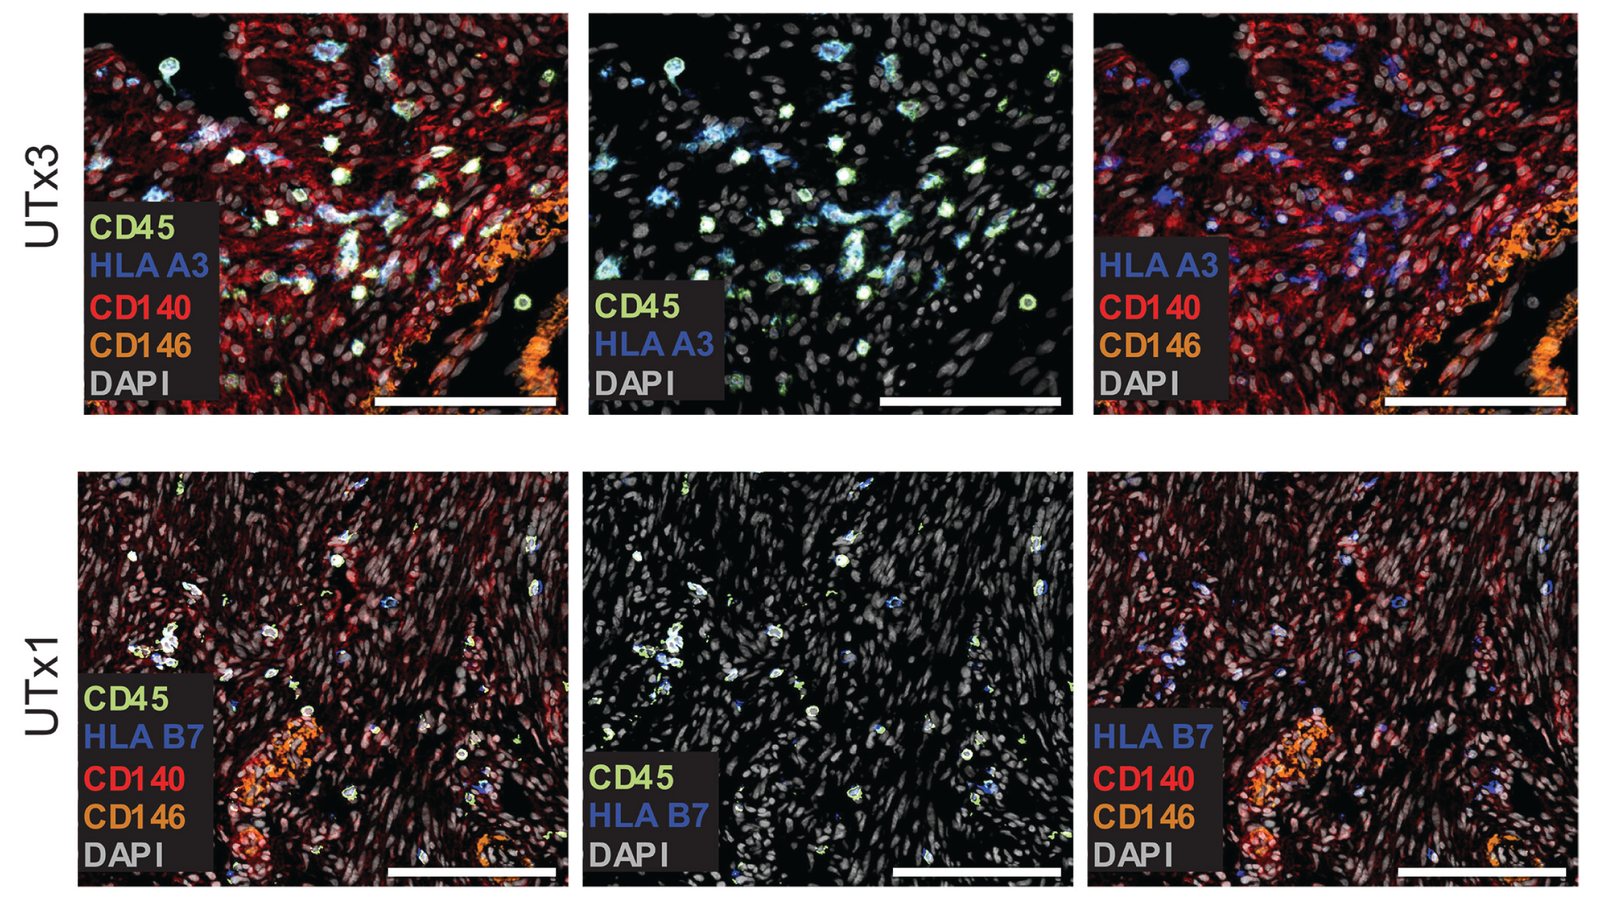
Immunofluorescence of transplanted uterine tissue from two recipients, staining immune cells (CD45) together with an HLA type that tells donor and recipient cells apart, stromal and vascular markers (CD140, CD146) and nuclei.

Clinical Translation

Niklas Björkström's group bridges Karolinska Institutet and Karolinska University Hospital, pairing high-dimensional immune profiling with patient sampling. Endoscopy-guided sampling mapped the immune landscape of the bile ducts in primary sclerosing cholangitis, and tracking donor and recipient cells after uterus or stem cell transplantation showed the uterine immune system reconstituting at the transcriptomic, phenotypic and spatial level. The group will help lead the cluster's translation of spatial biology toward precision diagnostics.

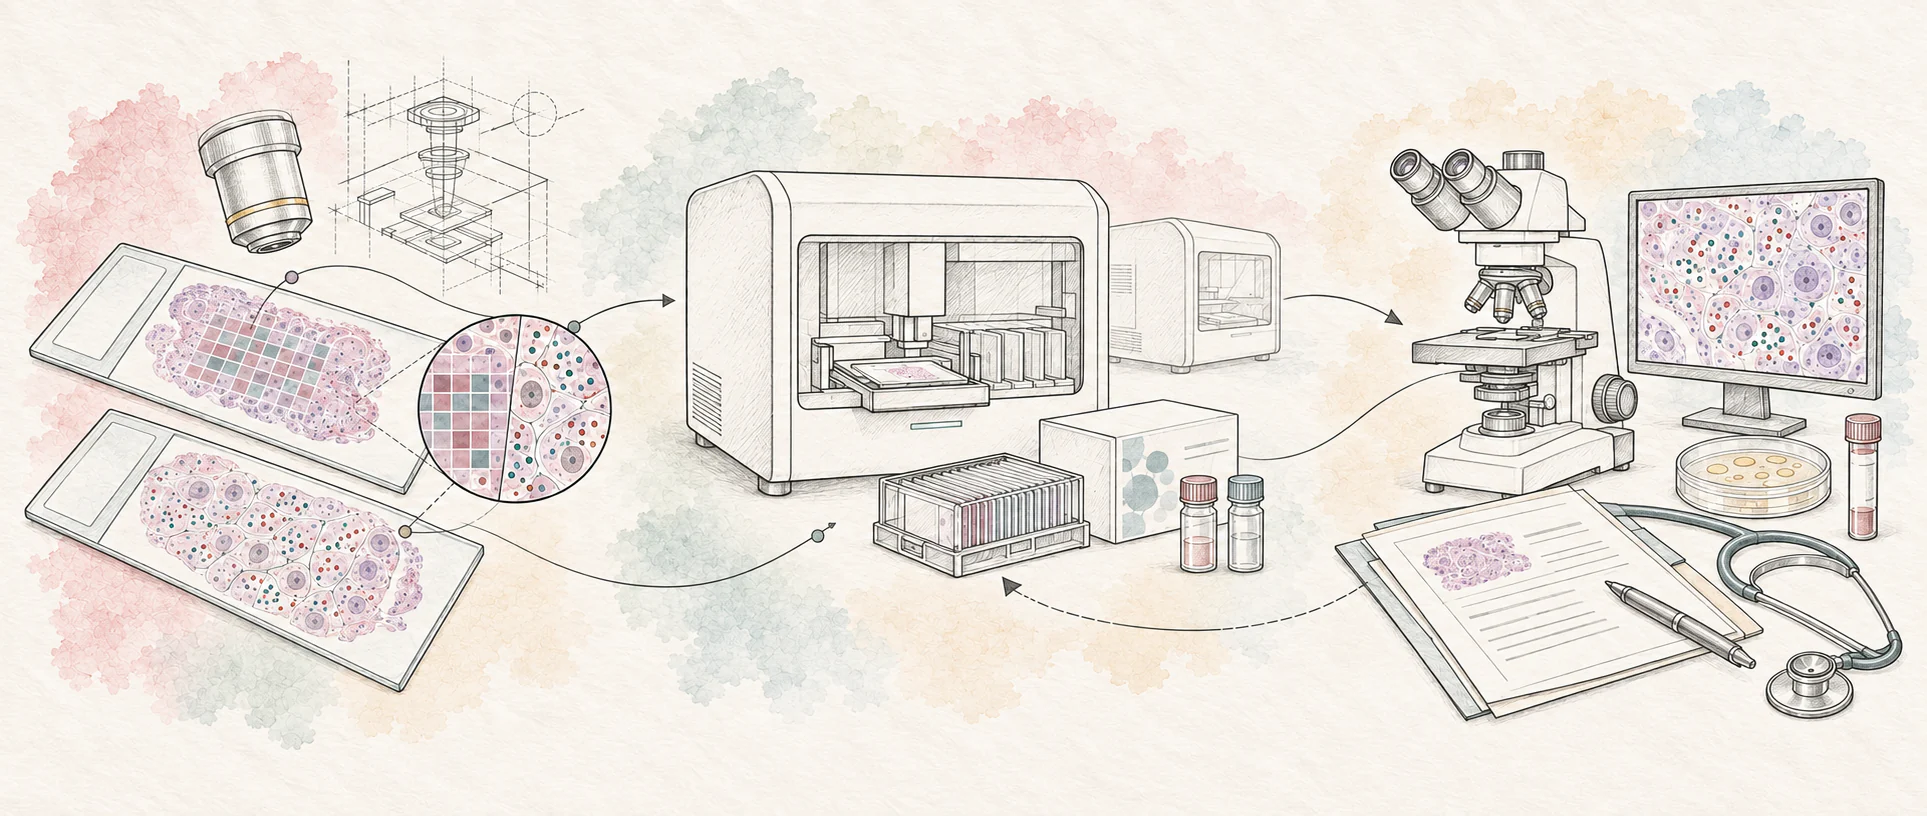
Pencil and watercolour illustration: tissue sections on slides lead through a magnified view of a profiled region into benchtop instruments and reagent kits, then on to a microscope, an on-screen cell map and a clinical report with a stethoscope, with a dashed arrow running back from the clinic to the bench.

From research methods to useful tools.

Methods from the cluster's groups have become commercial spatial platforms.

  • Acquired by 10x Genomics · 2018

    Visium

    Spatial Transcriptomics AB

    Joakim Lundeberg, Jonas Frisén and Patrik Ståhl

  • Acquired by 10x Genomics · 2020

    Xenium

    Cartana AB

    Mats Nilsson and colleagues at Stockholm University

Platforms and Companies

Two of the most widely used spatial platforms began in the cluster's groups. Spatial Transcriptomics AB, founded by Joakim Lundeberg, Jonas Frisén and Patrik Ståhl to commercialise barcoded capture arrays, was acquired by 10x Genomics in December 2018; the Stockholm team joined the company and the method became Visium. Cartana grew out of Mats Nilsson's in situ sequencing at Stockholm University and was acquired by 10x Genomics in August 2020; its in situ chemistry became part of Xenium, and Nilsson joined as a scientific advisor.

The full story
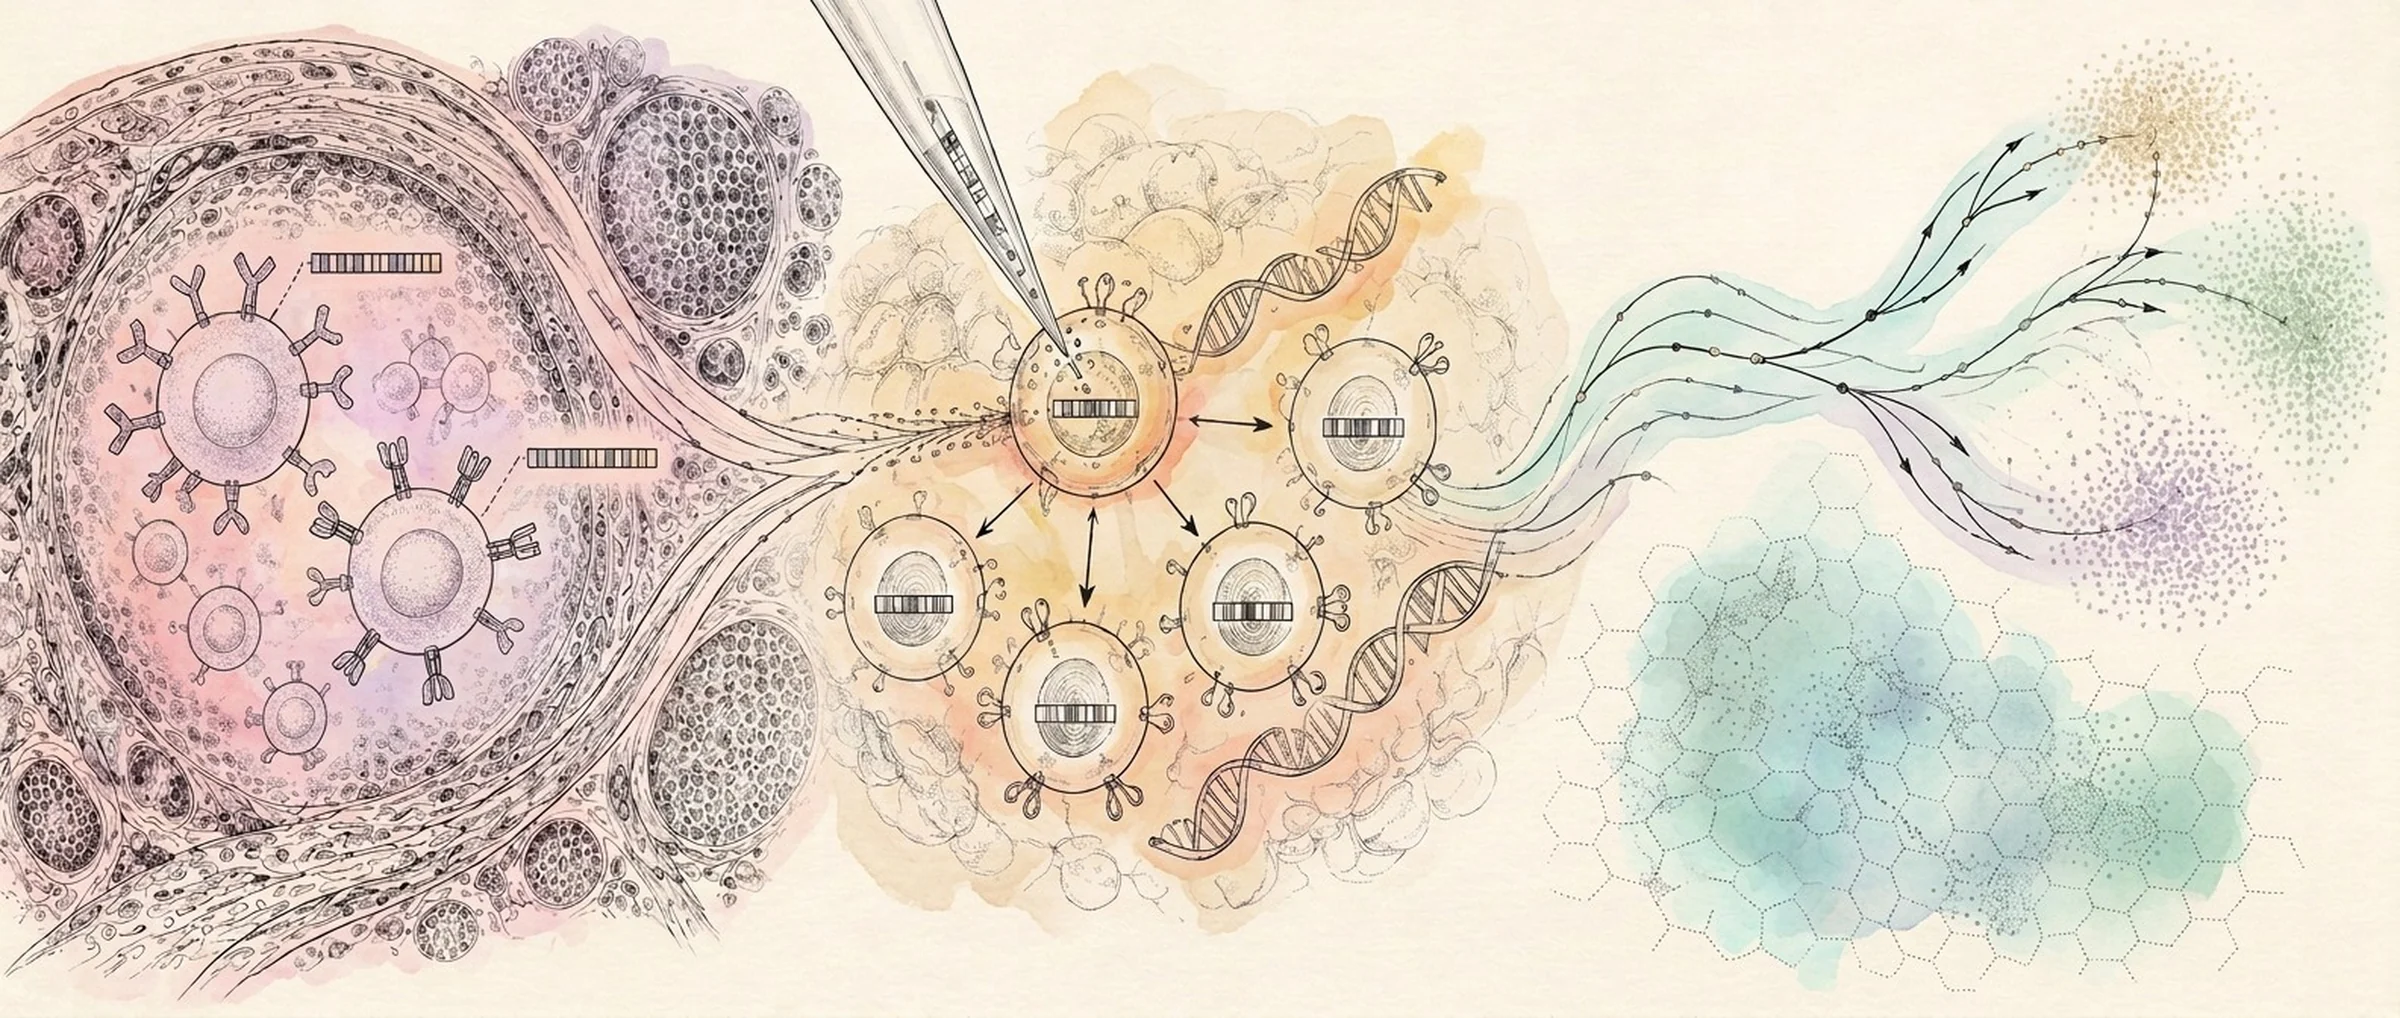
Watercolour and ink illustration: immune cells bearing receptors within a vessel, a pipette injecting a cell whose barcoded descendants divide outward alongside strands of DNA, and branching lineage trajectories resolving into clusters of cell states.

Giving spatial maps a history.

Members of the cluster build methods that record where cells came from and place their descendants in tissue.

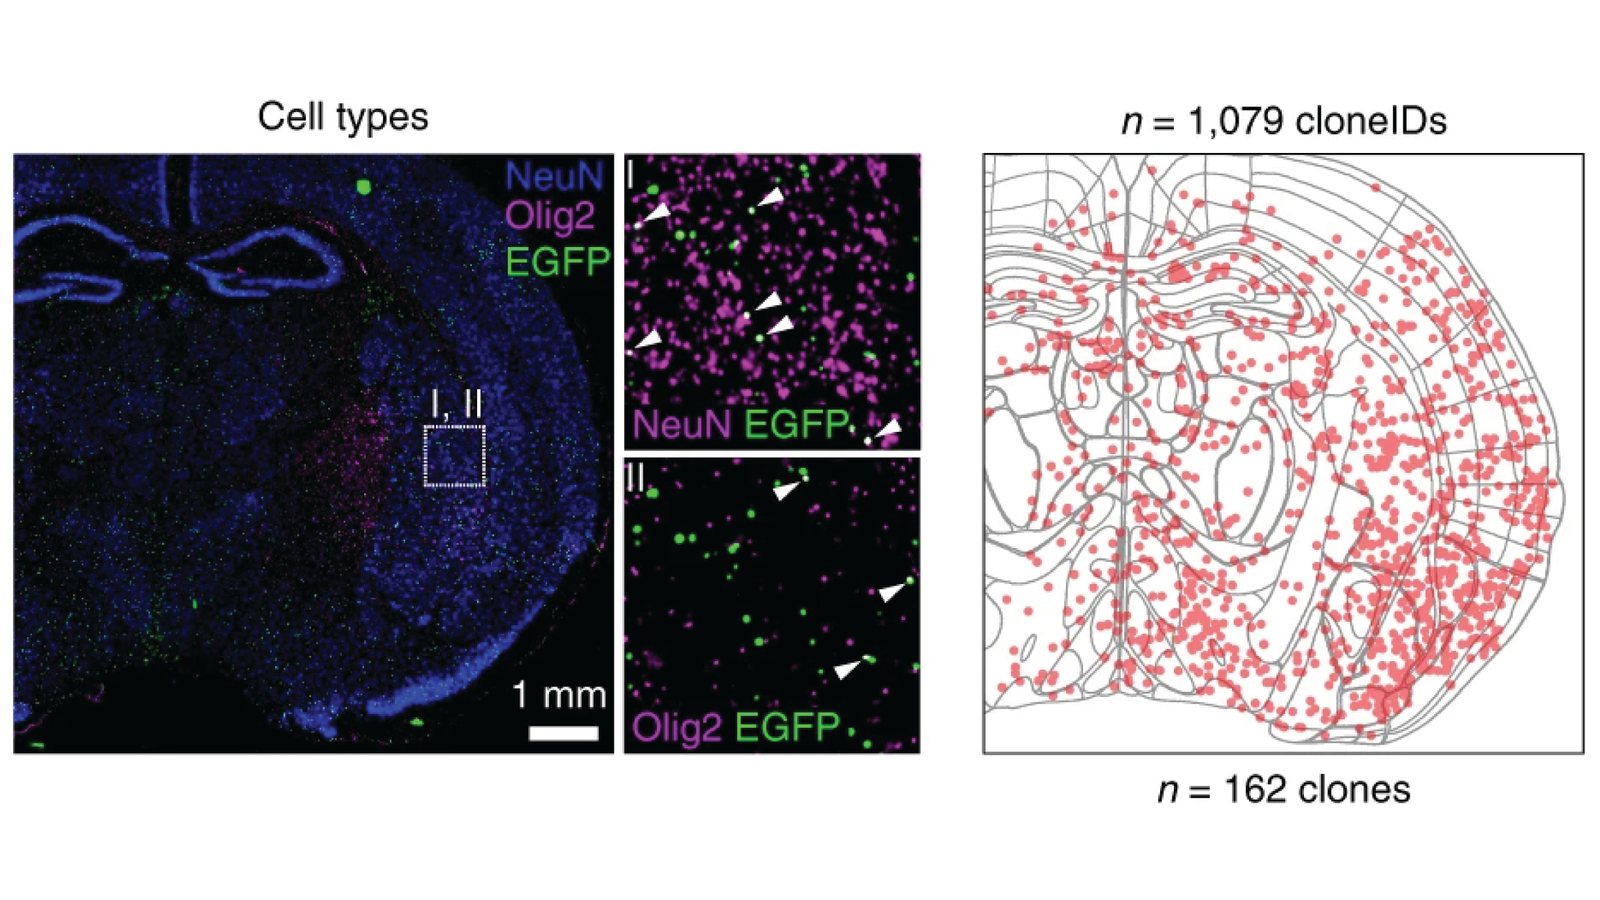
A mouse brain section stained for neurons, oligodendrocyte-lineage cells and barcoded cells, beside an atlas outline marking where 1,079 barcodes from 162 clones were read out in the tissue.

Spatial Readout of Clonal Barcodes

As a postdoctoral researcher, Michael Ratz developed TREX and its spatial counterpart, Space-TREX. Heritable barcodes delivered to early neural progenitors are read out together with each cell's transcriptome, and Space-TREX reads the same barcodes directly in tissue sections, placing each clone in its anatomical context in the brain. Reconstructing thousands of clones this way revealed fate-restricted progenitors in the mouse hippocampal neuroepithelium. The Ratz group, started in 2023, uses barcoding to study how neural circuits assemble, and has co-developed Perturb-TREX, which adds genetic perturbation to clonal tracing.

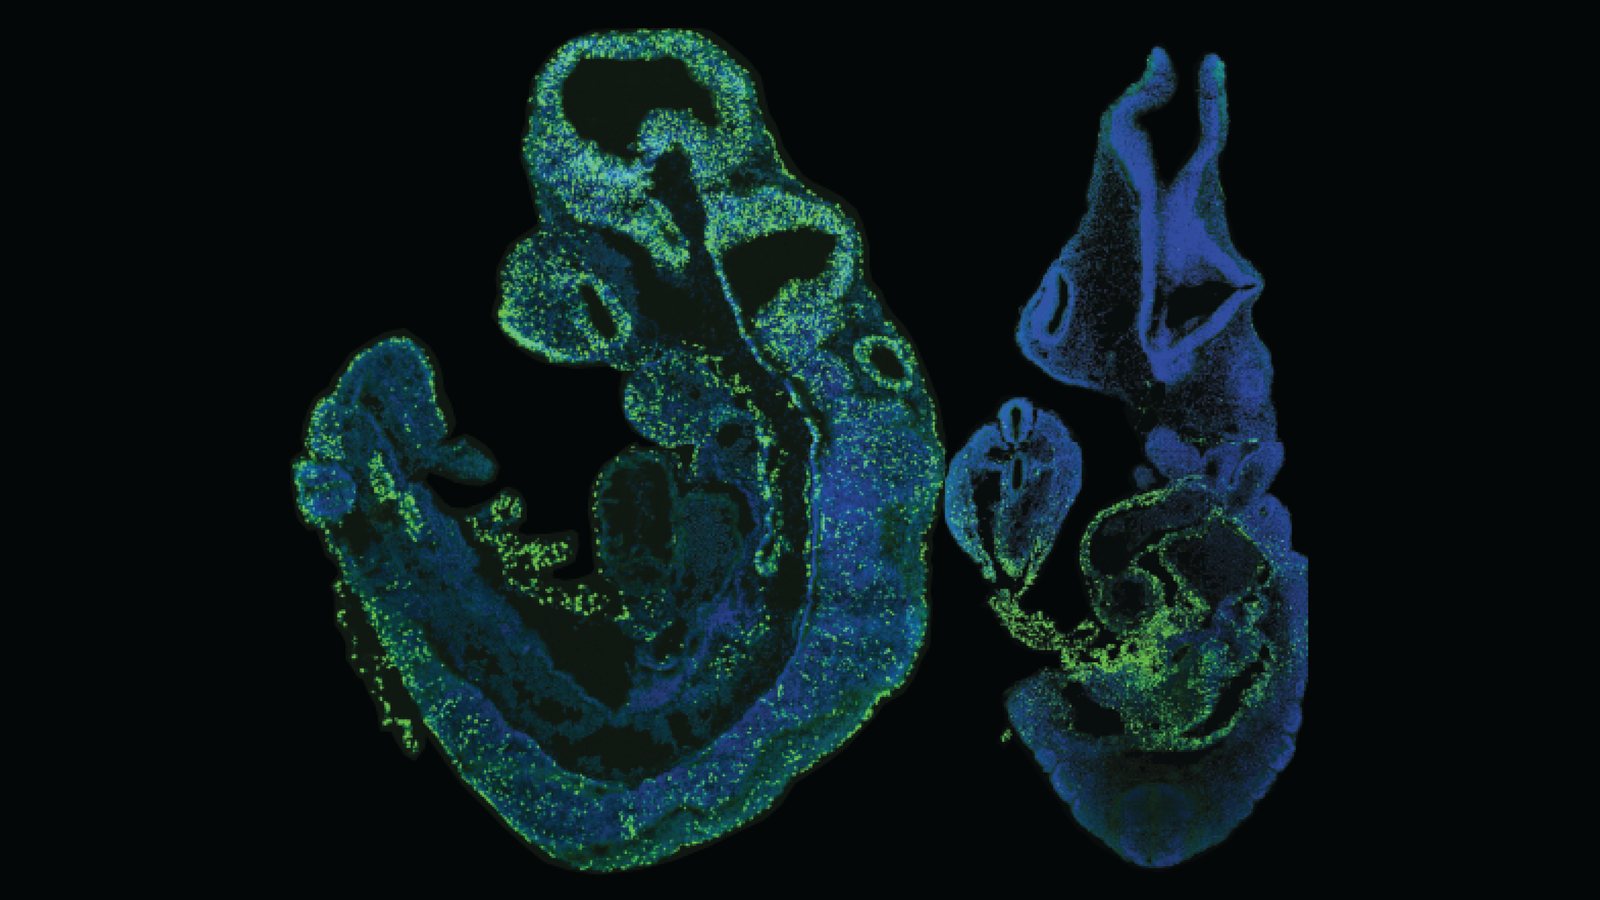
Sections of two mouse embryos on black, with nuclei in blue and virus-labelled cells in green spread through the developing nervous system.

In Utero Nano-Injection

Emma R. Andersson's group developed NEPTUNE, which delivers virus into the neural plate of the mouse embryo before the nervous system forms. It integrates in more than 95% of brain cells, an alternative to knockout and knock-in mice that take months to years to generate. Combined with heritable barcodes and single-cell lineage tracing, the approach resolved how the nervous system, neural crest and inner ear separate into distinct lineages early in development. Nano-injection into the exocoelomic cavity now extends it to the mesoderm: combining single-cell lineage tracing of lentiviral barcodes with deconvolution of spatial transcriptomics data resolved the spatial fates of more than 31,000 clones, revealing the clonal architecture of the liver and heart mesenchyme.

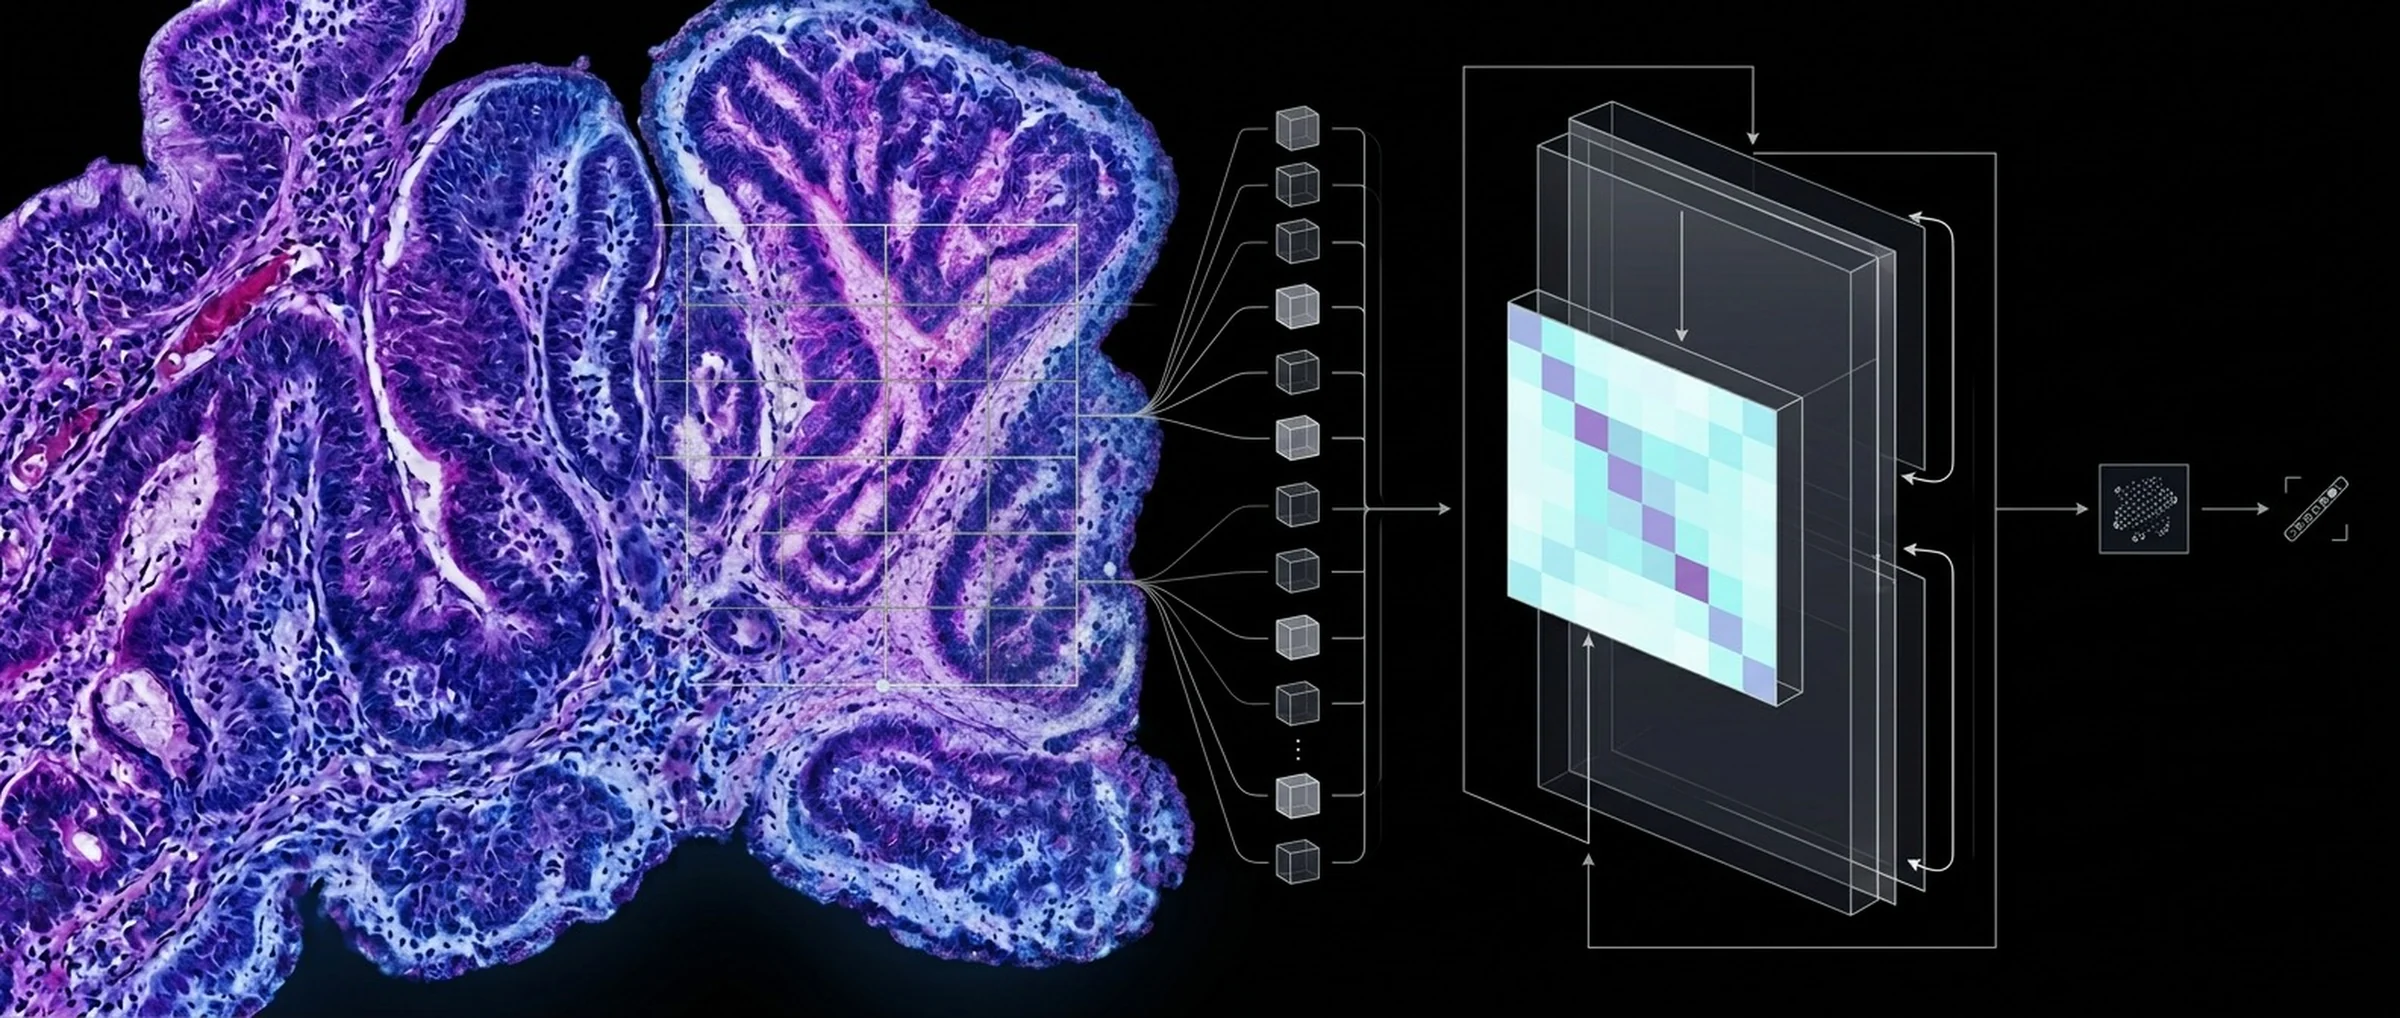
A stained tissue section overlaid with a sampling grid, its patches fed as tokens into a stack of model layers that produce a matrix of learned features and, from it, a compact prediction.

Turning images and molecular data into understanding and prediction.

Members of the cluster developed computational tools and novel AI-based strategies for modelling cells and deciphering molecular and histological patterns.

Spatial experiments produce data far too large and complex to read by eye. AI-supported computational tools support the design of experiments, and make their results interpretable, explorable, and predictive.

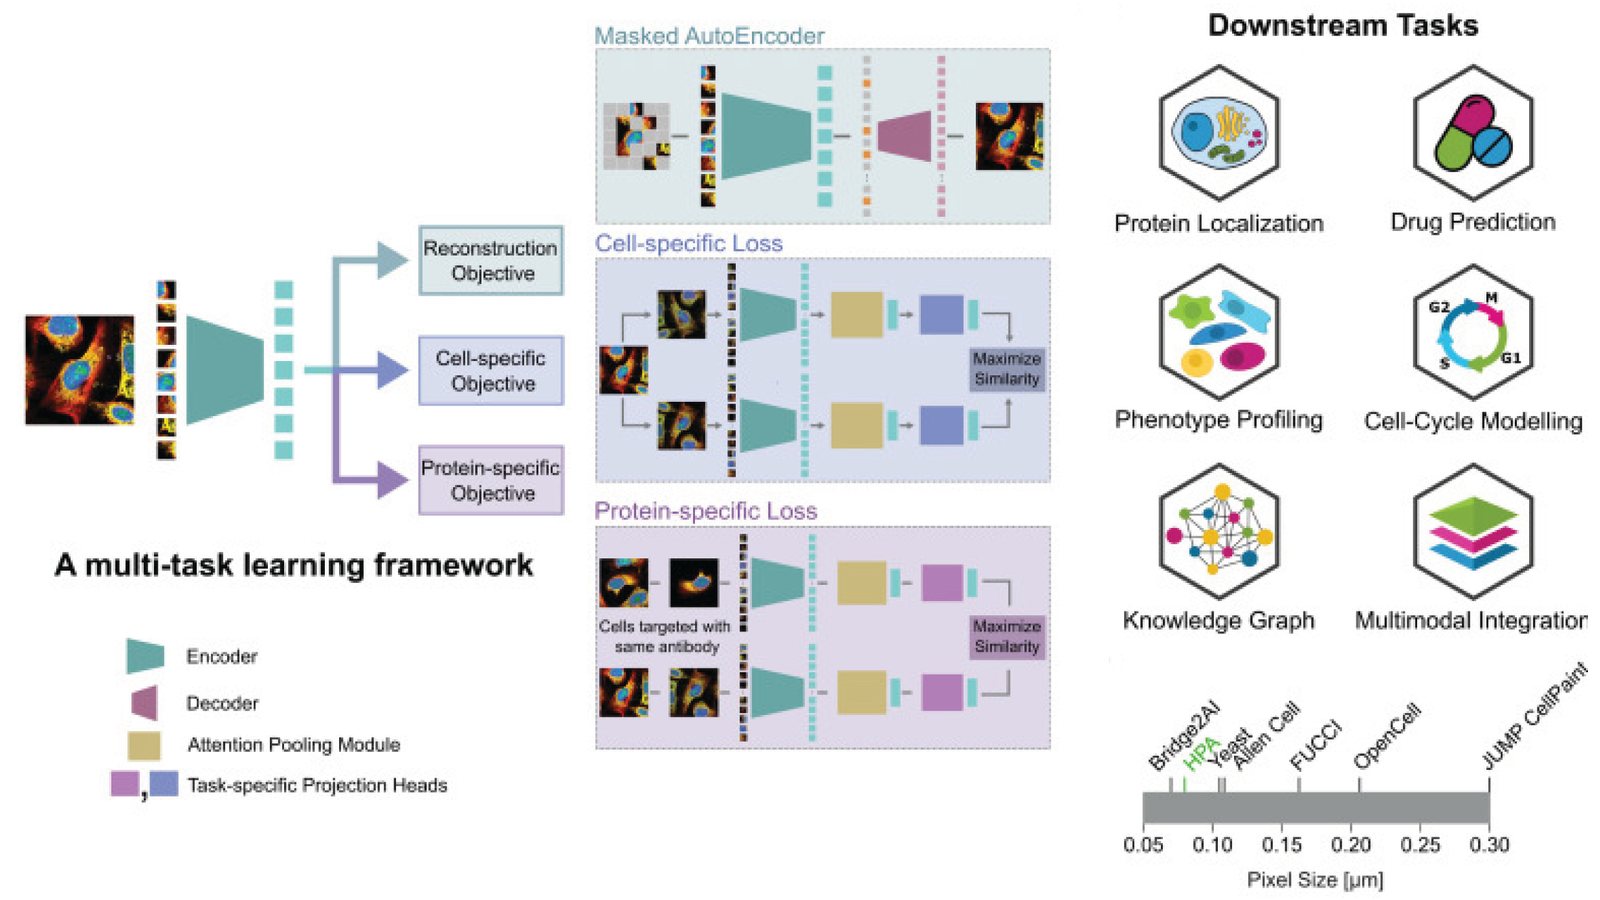
Diagram of SubCell, a multi-task learning framework that encodes fluorescence images of cells, and the tasks it supports, from protein localisation and phenotype profiling to cell-cycle modelling and multimodal integration.

AI Models of Cells

Emma Lundberg's group trains self-supervised vision models on the Human Protein Atlas's proteome-wide image collection. SubCell captures morphology, protein localisation and cell organisation, and generalises to other fluorescence microscopy data without fine-tuning. Lundberg also co-authored a roadmap for building a virtual cell with artificial intelligence.

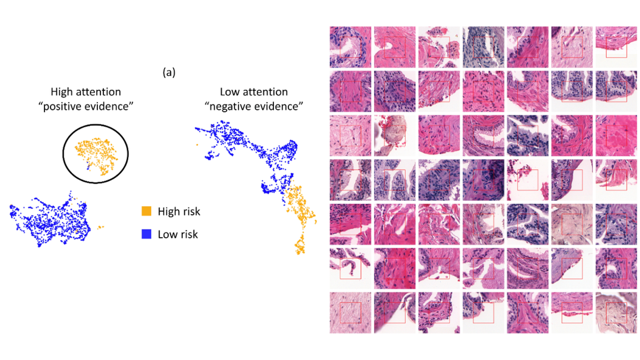
Left: image tiles from prostate biopsies plotted by their learned features, coloured high risk and low risk, separating high-attention “positive evidence” from low-attention “negative evidence”. Right: a grid of hematoxylin-eosin stained tissue tiles.

AI Models of Histology

Routine clinical H&E-stained tissue contains a wealth of information, and visual assessment may miss clues of future disease. Carolina Wählby and collaborators showed that unsupervised pre-trained AI models can extract pathology-relevant morphological patterns from histology slides, and the molecular relevance of these patterns was confirmed by spatial transcriptomics. Wählby’s group also showed that manual annotation can be improved by interacting with AI, and that weakly supervised AI can detect prognostic morphological patterns in benign biopsies.

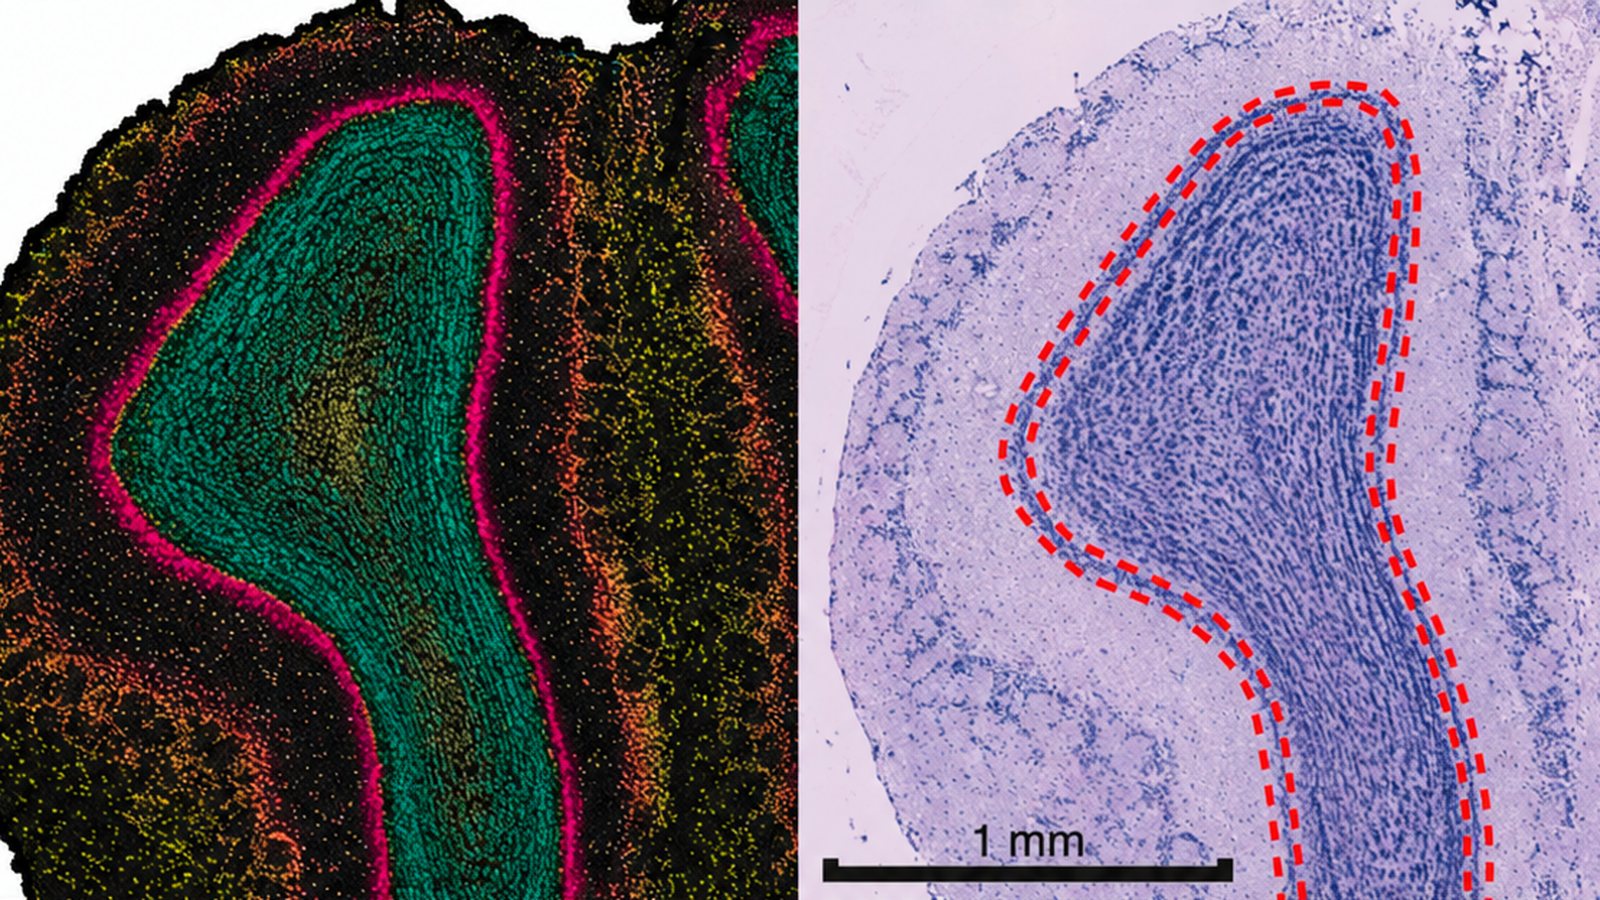
A spatial gene-expression map of a tissue section beside the matching stained histology section, with the corresponding region outlined in red.

Gene Expression from Histology

Deep learning trained on matched histology and spatial data can predict local gene expression from an ordinary hematoxylin-eosin stained section. Joakim Lundeberg and collaborators showed this in breast cancer, then developed a deep generative model that fuses histology with spatial data to infer expression maps at micrometre scale. Carolina Wählby's group has reviewed how translating and integrating morphology is reshaping spatial analysis.

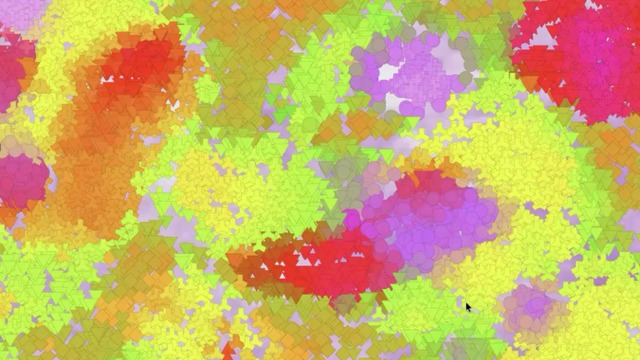
A tissue region rendered as overlapping coloured patches, graded from yellow and green through orange and red to purple, marking clusters of similar gene expression.

Learning-Based Niche Detection

Imaging-based spatial transcriptomics can be explored at multiple scales, from subcellular patterns to single cells and functional niches. Carolina Wählby’s group has developed tools for both graph-based and clustering-based unsupervised partitioning of the tissue at multiple scales. The latest work is SFUMATO, a GPU-accelerated Bayesian probabilistic clustering and visualisation framework for spatial transcriptomics that mimics biological gradients through colour coding.

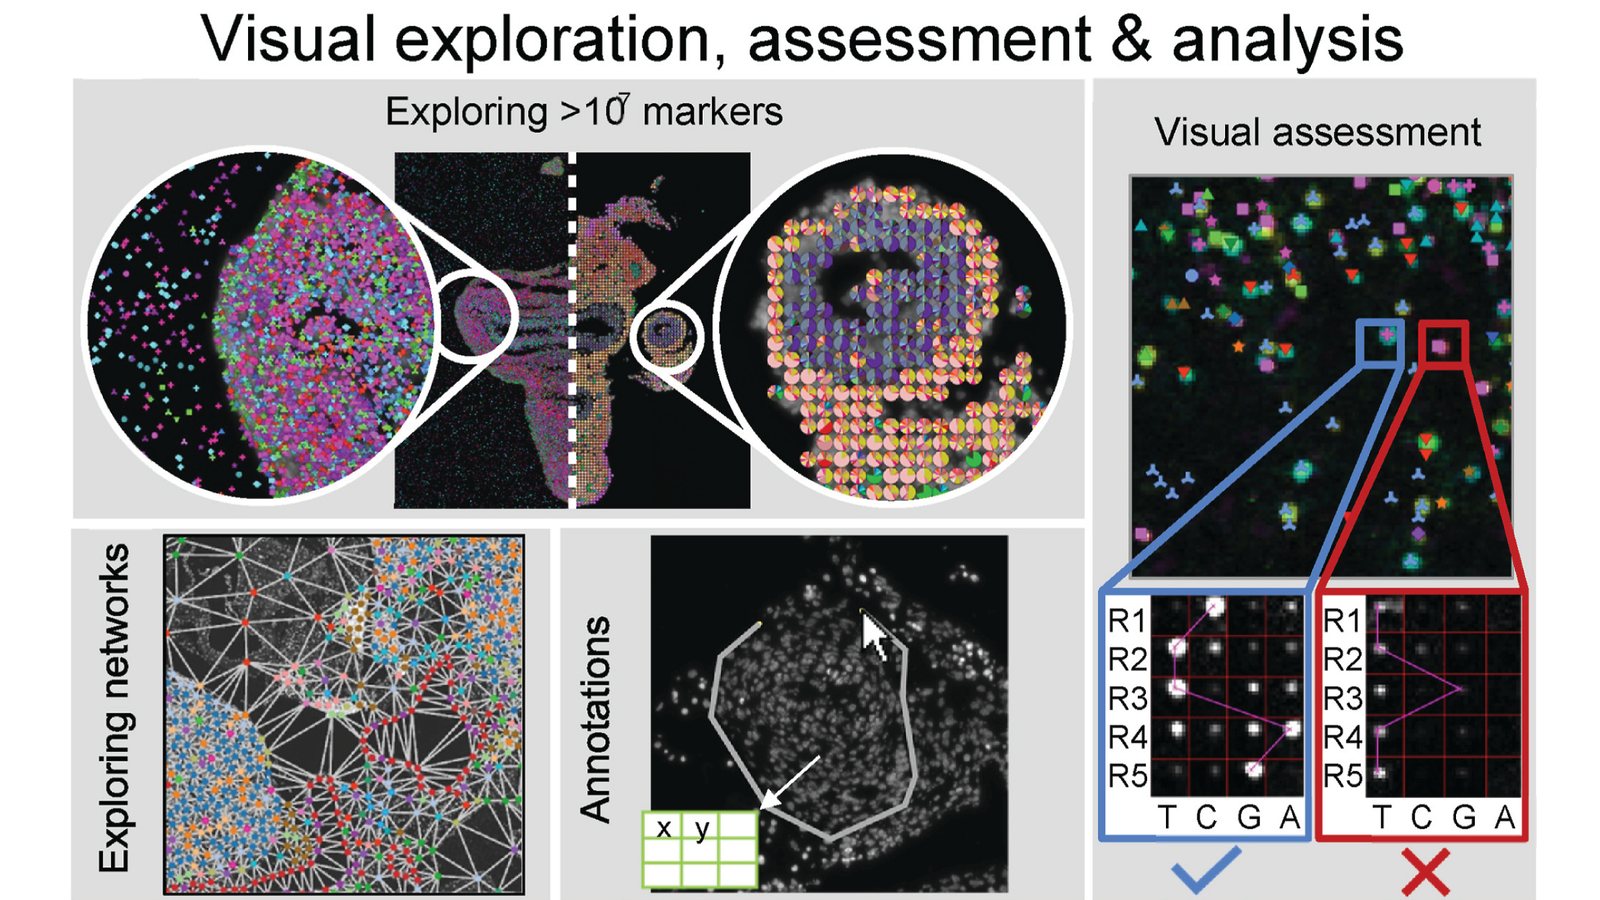
TissUUmaps views: exploring more than ten million markers across a tissue section, exploring networks of neighbouring cells, drawing annotations, and visually assessing decoded in situ sequencing signals.

Image Analysis and Exploration

Carolina Wählby's group builds AI and visual tools for microscopy and digital pathology. TissUUmaps overlays millions of data points on a tissue image for interactive exploration, in a browser or locally, and SimSearch lets a microscopist train a deep-learning model from a handful of examples to find regions of interest across large experiments. Gonçalo Castelo-Branco's group develops KaroSpace for exploring spatial omics across samples and modalities.

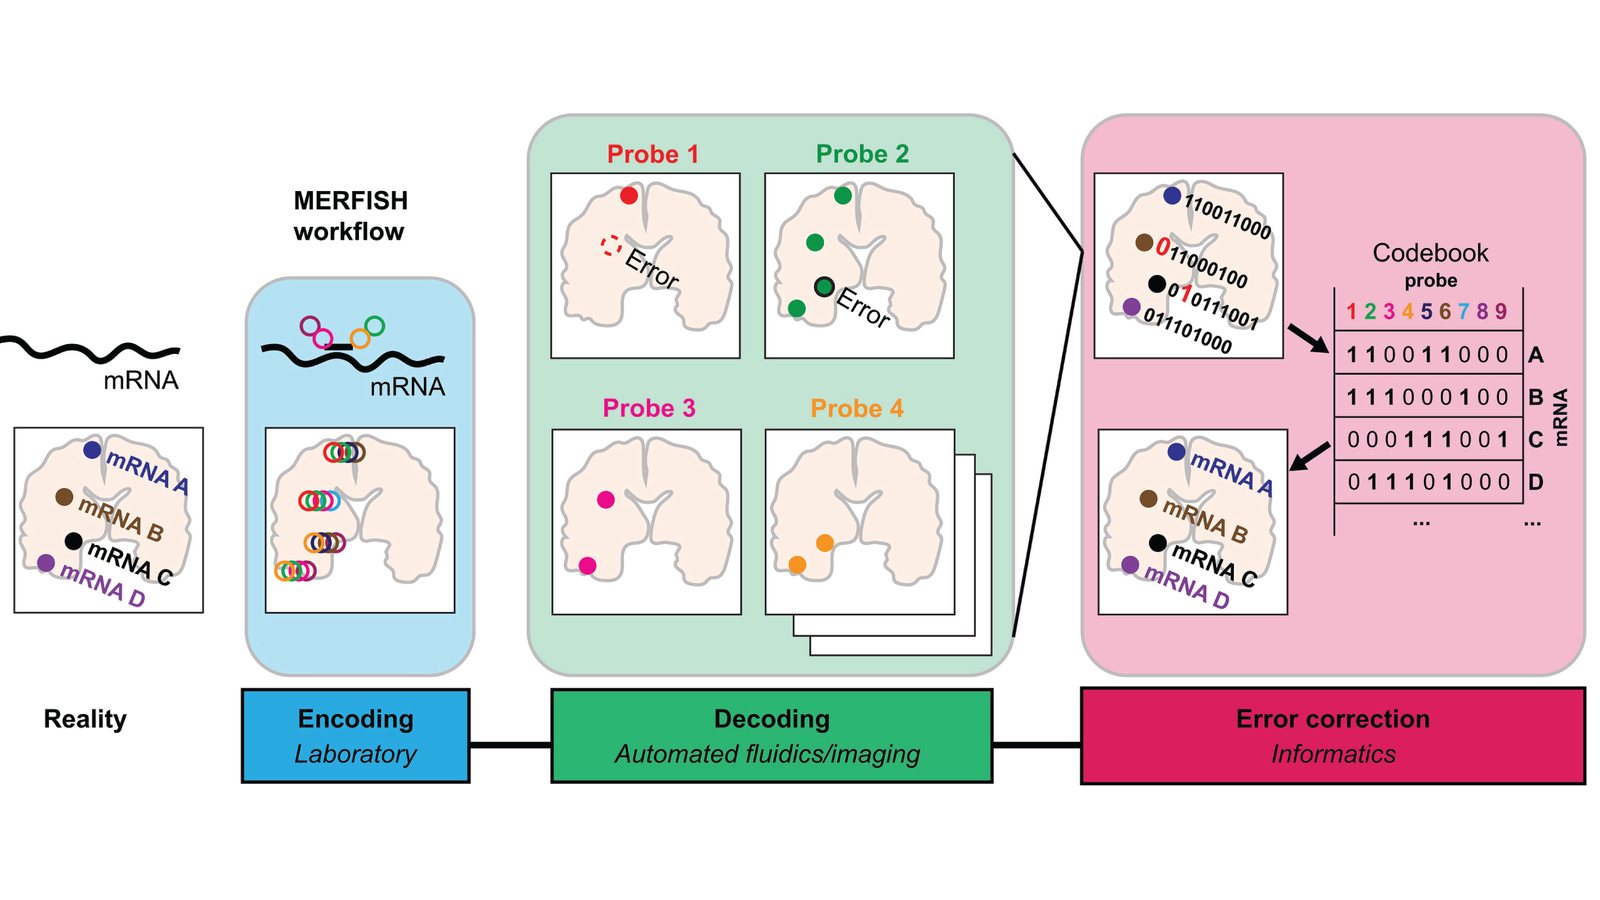
Diagram of the MERFISH workflow: transcripts are encoded with probes in the laboratory, read out over successive imaging rounds, and error-corrected by matching each spot's binary barcode against a codebook.

Error-Robust Multiplexing

Imaging-based methods such as MERFISH read each gene as a barcode over successive rounds, using error-correcting codes so that a misread spot is not assigned to the wrong gene. For most experimental settings, finding the best such codebook is an unsolved mathematical problem. Igor Adameyko's group developed an iterative set-exchange approach that generates optimised codebooks, raising the number of genes these methods can multiplex. Carolina Wählby’s group developed a range of interactive tools for efficient inspection of raw data across sequencing cycles via TissUUmaps.

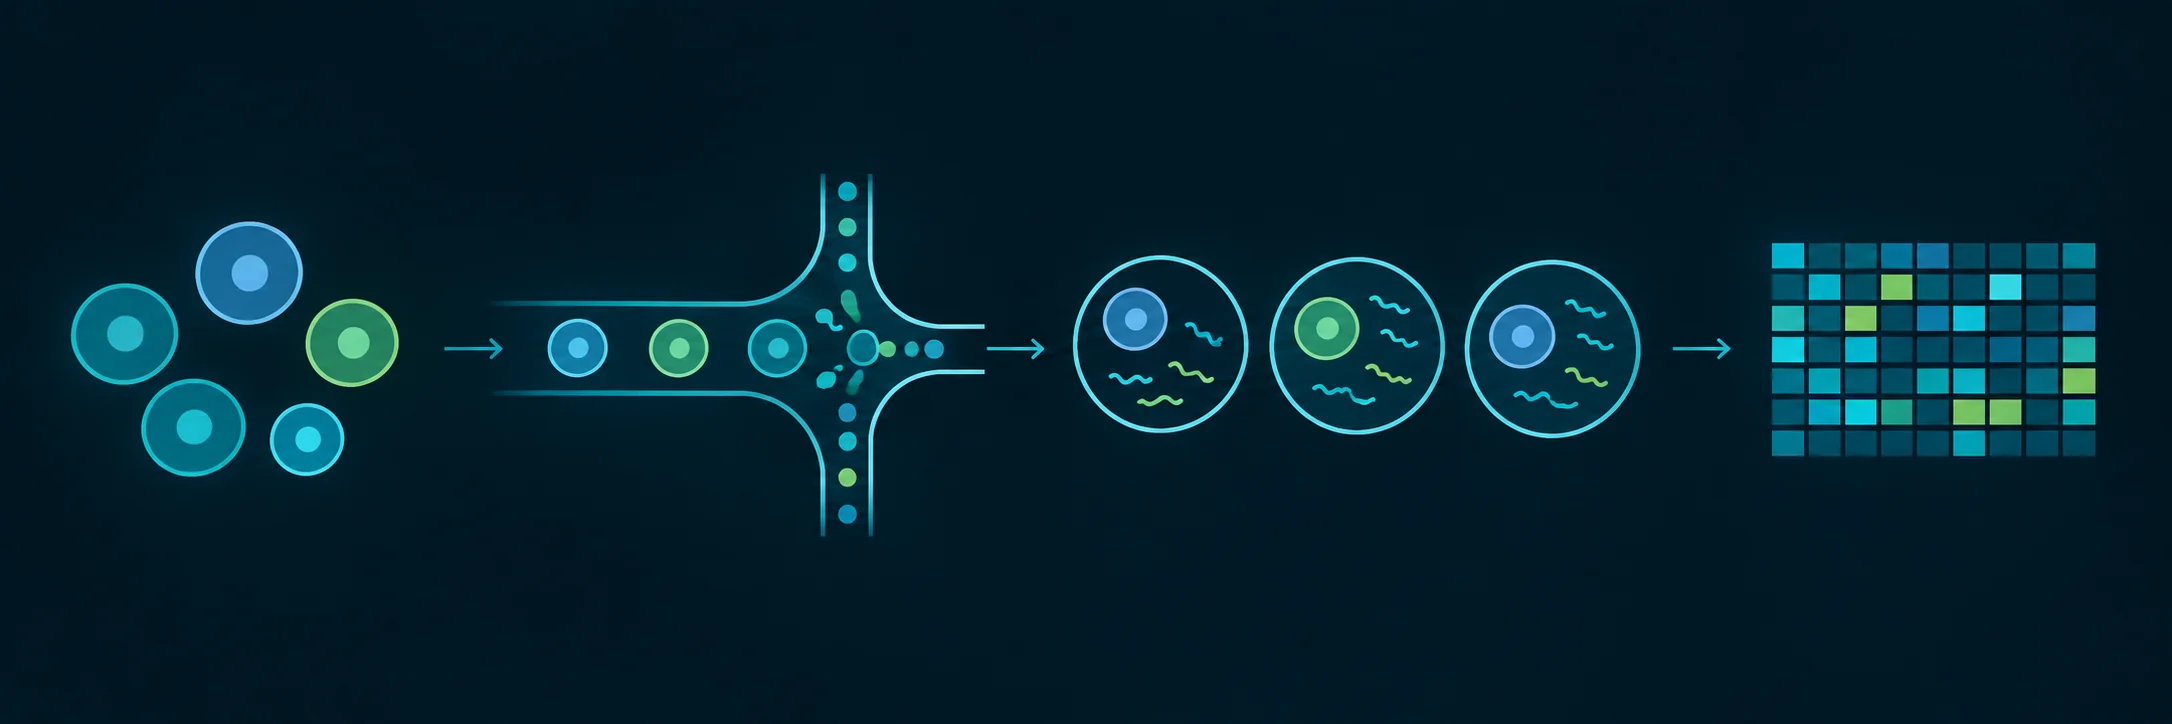
Single-cell sequencing in four steps: dissociated cells flow single file through a microfluidic channel, are captured one per droplet with their RNA, and end as a grid of expression values.

Profiling cells one at a time.

Alongside spatial measurement, members of the cluster build methods that resolve the molecular state of individual cells, how their genes are regulated and how they choose among fates.

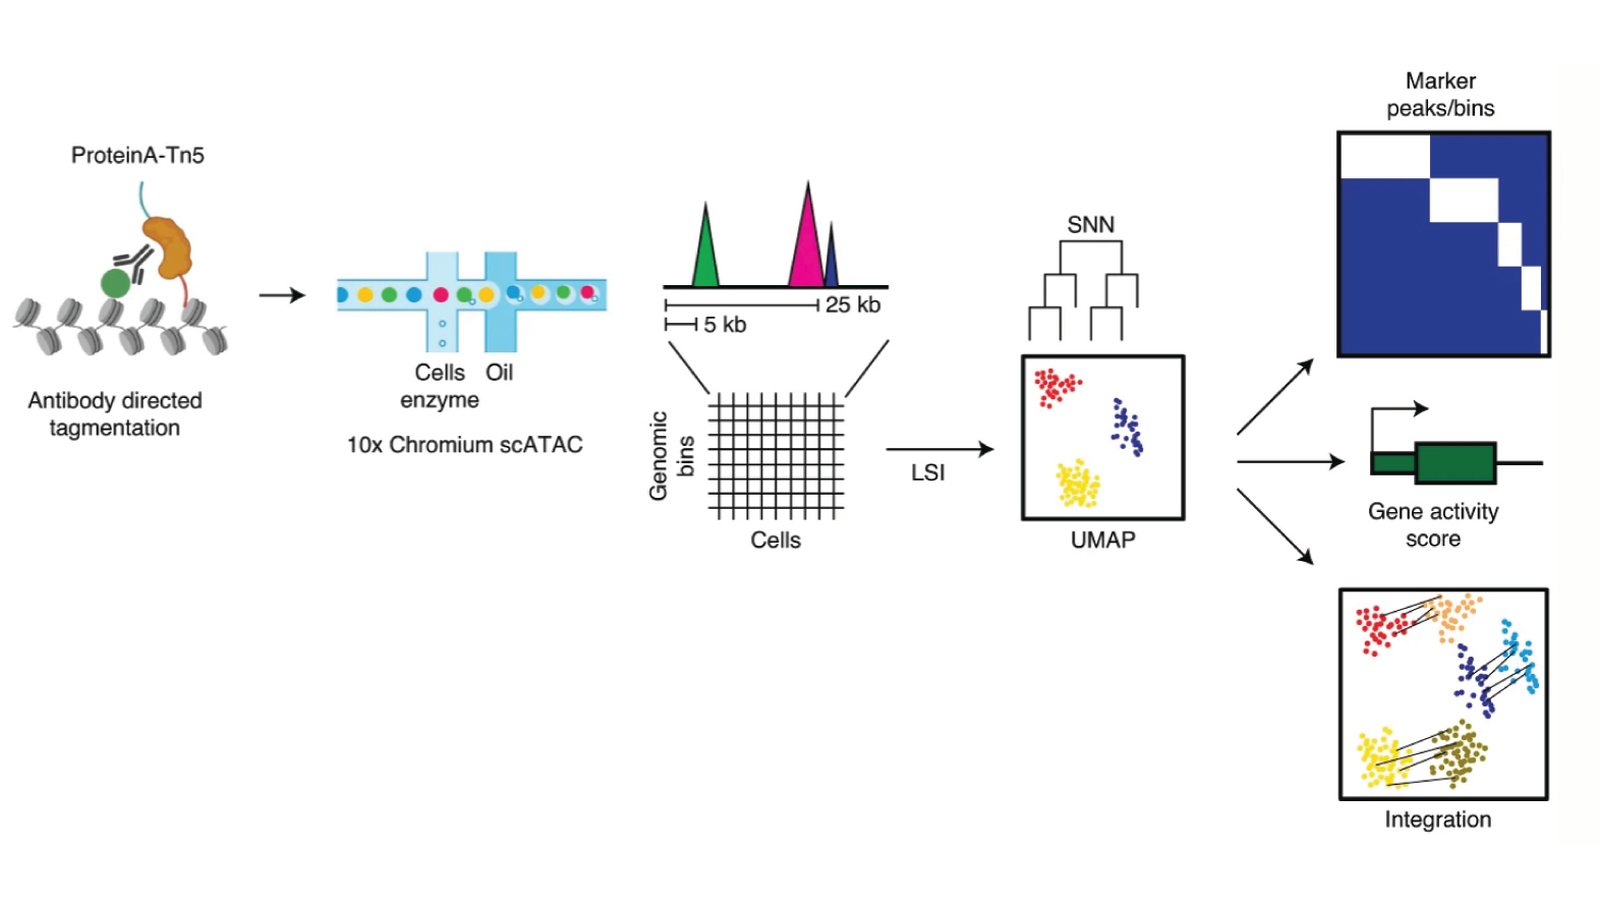
Single-cell CUT&Tag workflow: antibody-directed tagmentation with protein A-Tn5, single-cell partitioning on the 10x Chromium, then clustering of cells by their chromatin profiles into marker regions, gene activity scores and integration with other data.

Single-Cell Chromatin Profiling

Gonçalo Castelo-Branco's group developed single-cell CUT&Tag to profile histone modifications and transcription factors cell by cell in complex tissues, then nano-CUT&Tag, which uses nanobody–Tn5 fusions to map up to three epigenomic modalities in the same cells with higher sensitivity. These single-cell methods fed directly into the cluster's spatial epigenomics methods.

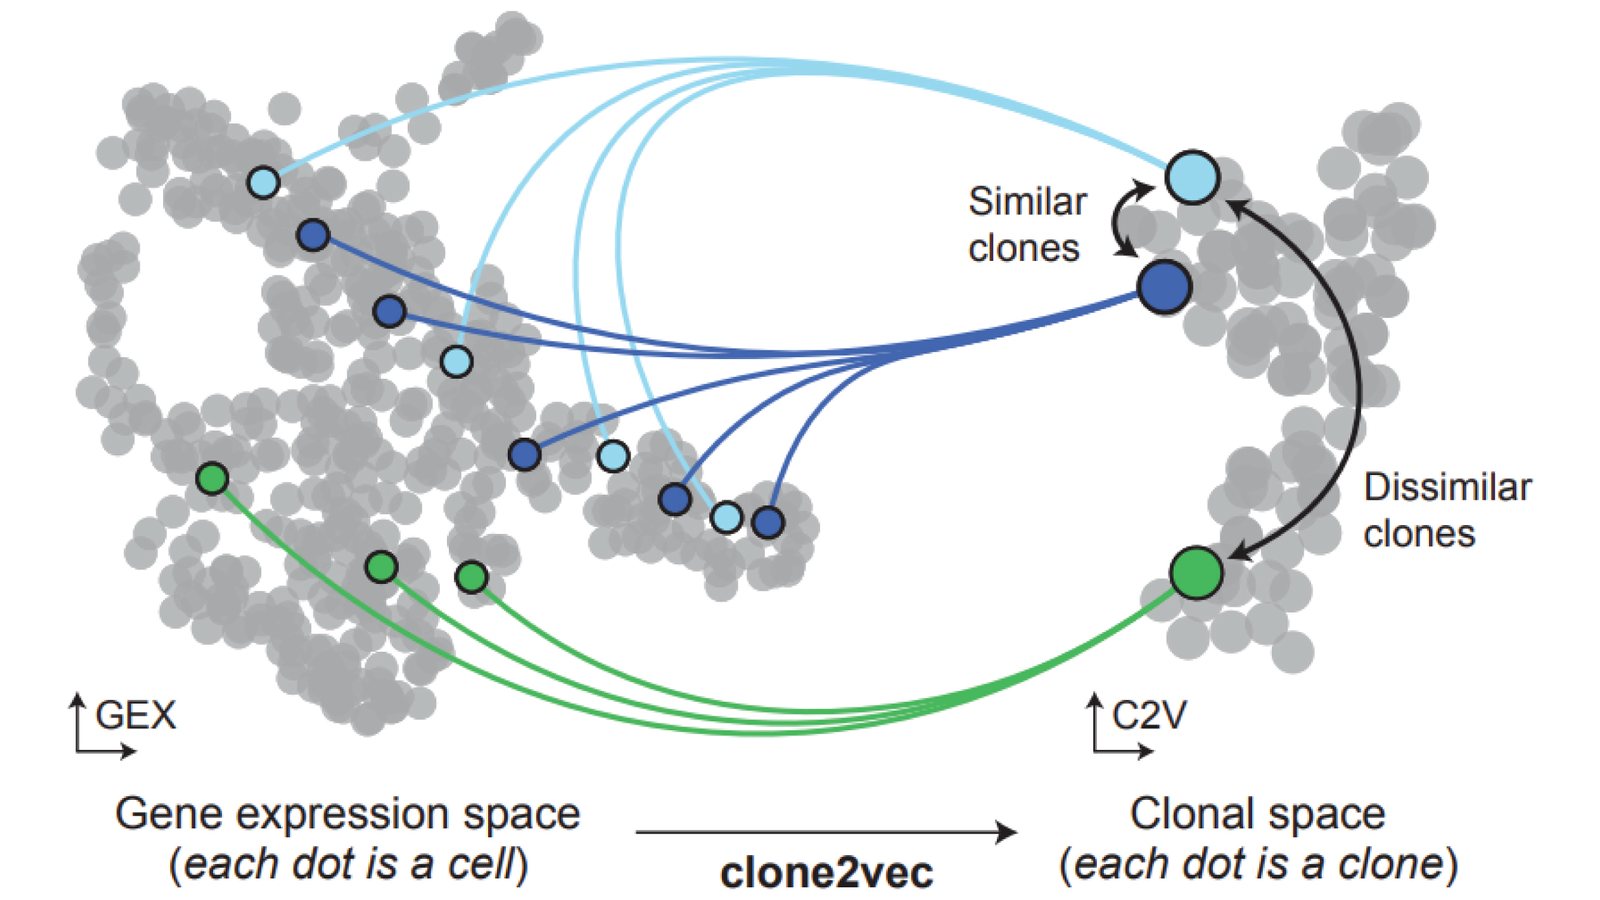
Diagram of clone2vec: cells of the same clone, scattered across gene-expression space, are mapped to single points in a clonal space where similar clones sit close together and dissimilar ones far apart.

Fate Decisions and Multipotency

Igor Adameyko's group models how progenitors choose among fates. scFates provides open-source tools for tree learning, pseudotime and bifurcation analysis in single-cell data, and a review sets out how competing, co-primed programmes let progenitor populations balance what they produce. With Peter Kharchenko, the group also developed clone2vec, a machine-learning method that learns a representation of each clone directly from its cells' gene expression, so clones can be compared without first assigning cell types. Applied to lineage tracing of mouse embryos in collaboration with the Andersson and Ratz groups, it revealed an embryo-wide gradient of clonal fate biases tied to anatomical position.

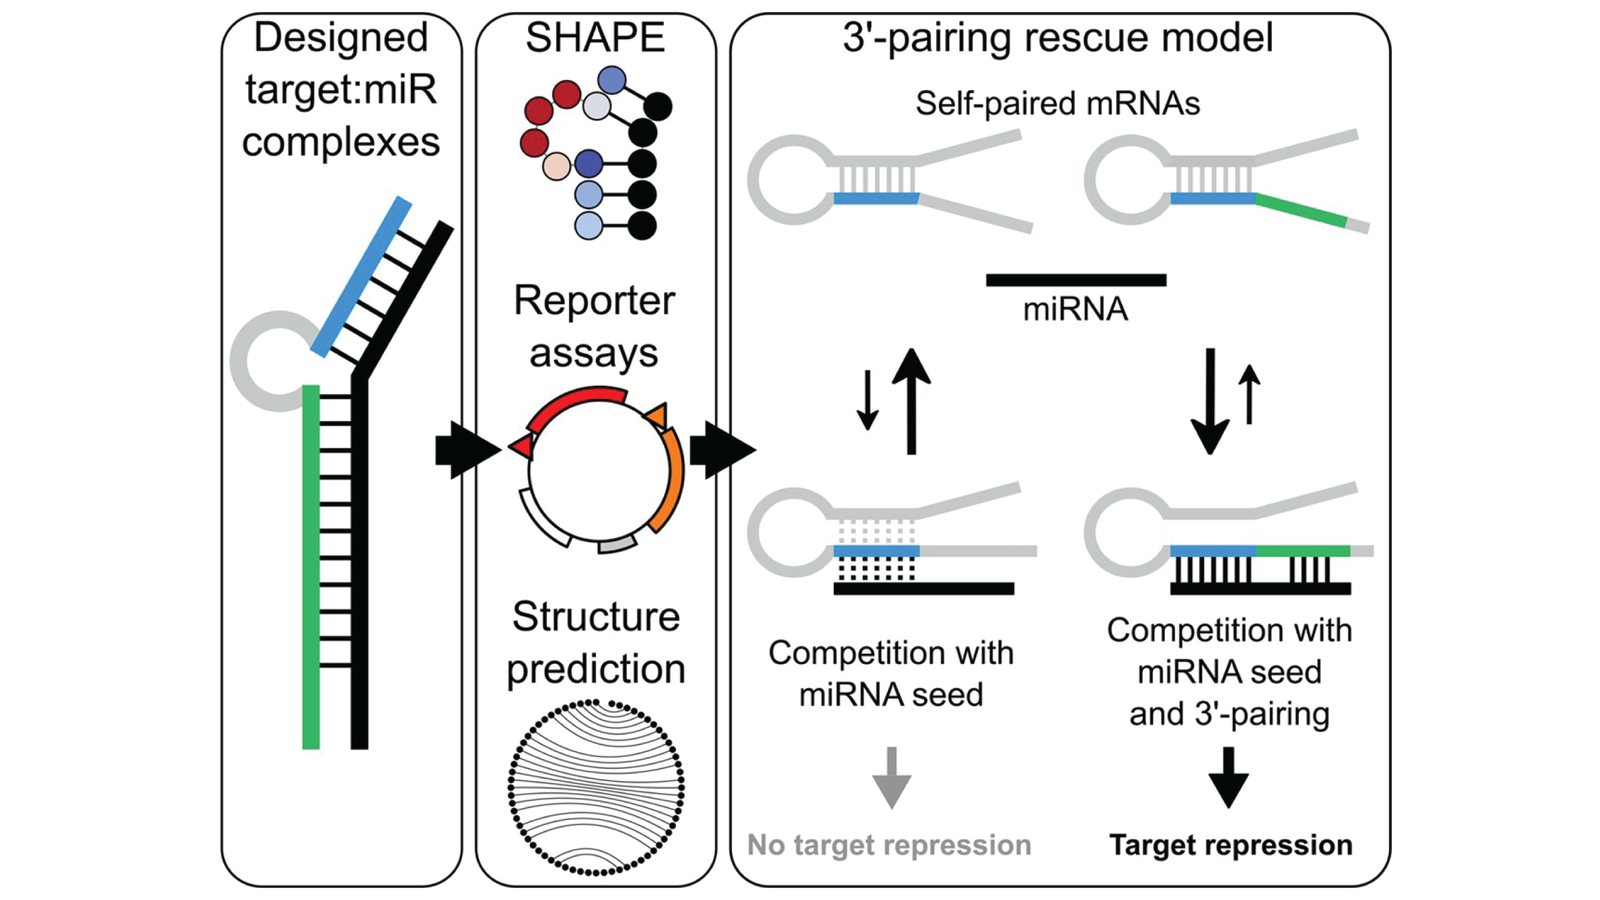
Diagram of the 3'-pairing rescue model: designed target and microRNA complexes are tested by SHAPE structure probing, reporter assays and structure prediction, showing how pairing beyond the seed lets a microRNA repress a target whose binding site is folded up.

MicroRNA Targeting

Emma R. Andersson's group maps how microRNAs choose their targets. Pairing beyond the seed region can compensate for a poorly accessible binding site, and chemically disrupting individual pairing positions shows which supplementary sites matter across the transcriptome and proteome.

Explore the full investigator directory.

All investigators